Thermodynamic Diagrams Spreadsheet
|
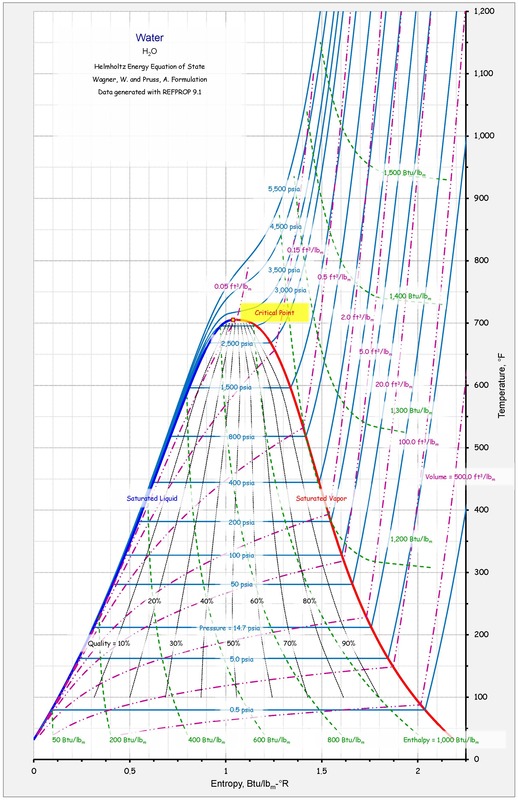
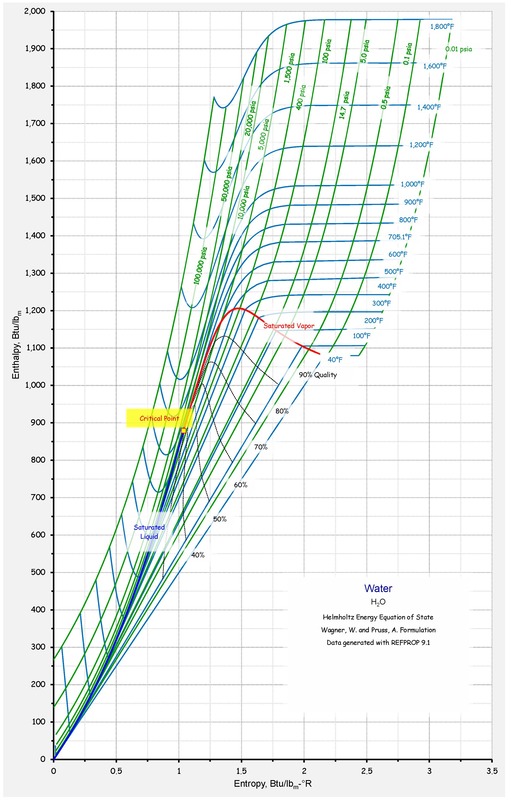
Thermodynamic diagrams are very useful tools for folks working in the HVAC industry. The psychrometric chart is probably the most common. But if you find yourself working with steam, the pressure enthalpy diagram for water, the pressure-enthalpy diagram illustrated below, or the temperature-entropy diagram illustrated to the left, or the entropy-enthalpy diagram (or Mollier diagram) illustrated below that can also be useful. 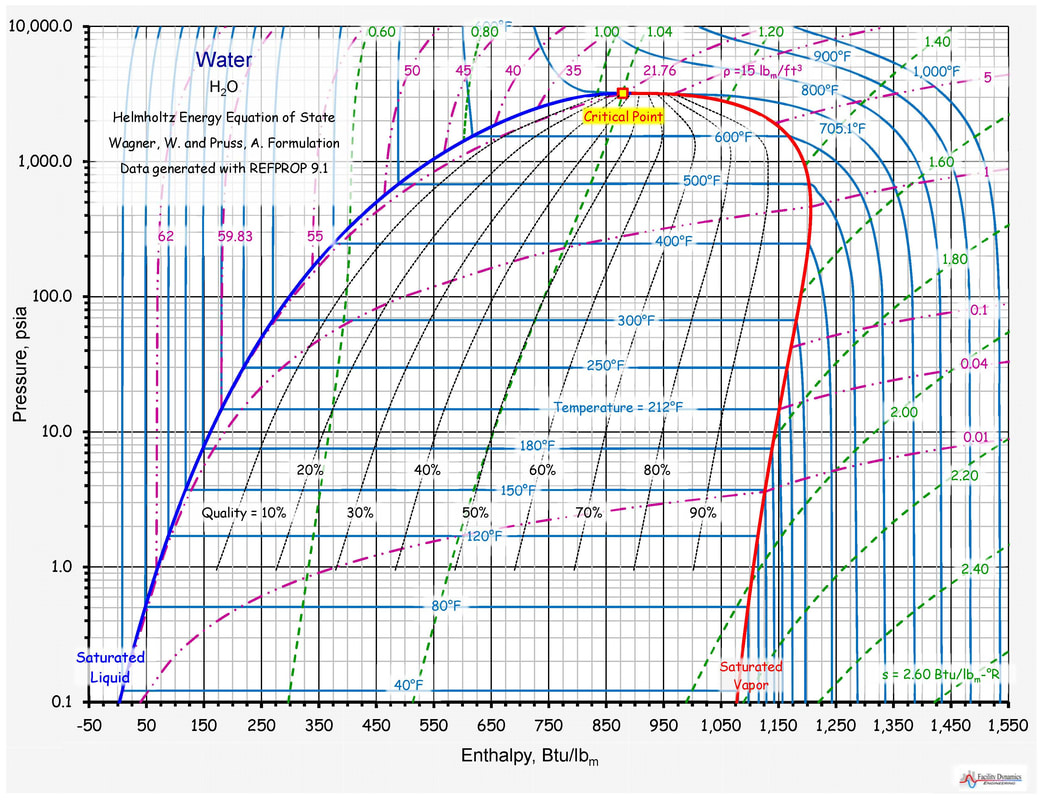
Of course, these diagrams can be quite intimidating at first.
One of the ways to become comfortable with them is to start working with them or looking at examples of working with them like the ones you will find in this blog post or in this application engineering guide from Sporlan that looks at working with the pressure enthalpy diagram for a refrigerant. I personally learned a lot and gained some comfort from plotting my own versions of the diagrams for steam, which are what I have used here to illustrate with and a p-h diagram for Refrigerant 134a. Facilitating that process was an application called REFPROP, developed by NIST (the National Institute of Standards). This link will take you to a blog post that tells you more about it and how to get a copy, including a free student version that will allow you to make your own charts for water, CO2, R134a, nitrogen, methane, propane, hydrogen, and dodecane (a possible alternative to jet fuel). I have also included the spreadsheet I used to make the charts shown here and a p-h diagram for R-134a if you want to download them and reverse engineer some of the Excel techniques I used to create them.
| ||||||