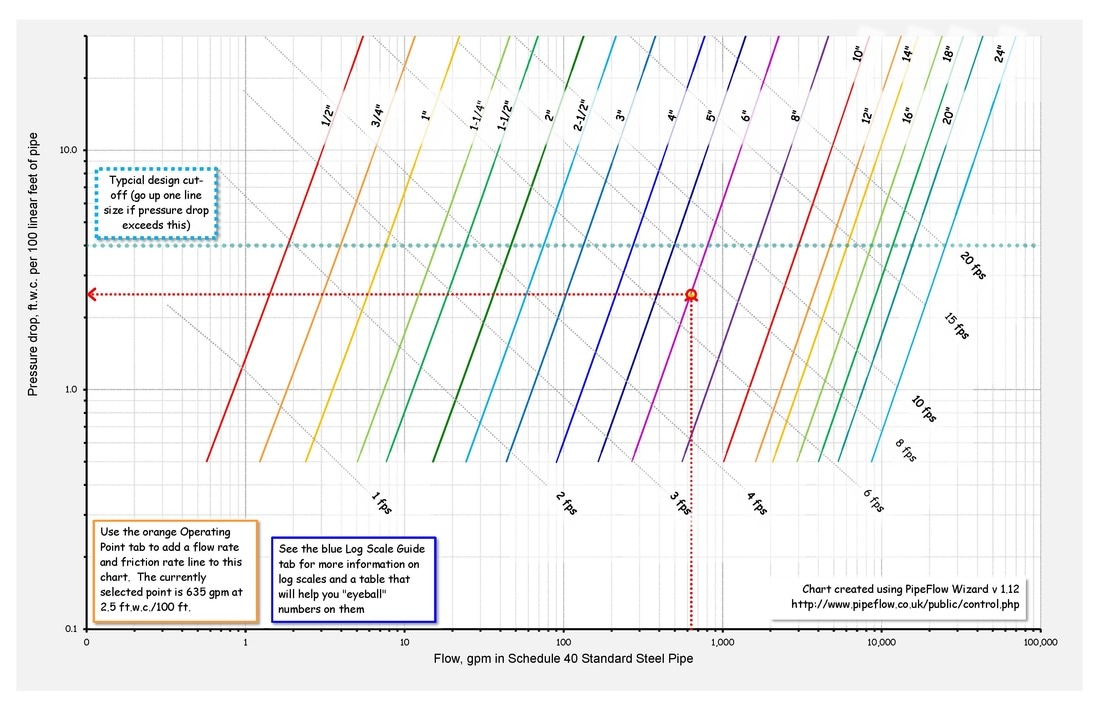
Pipe Friction Rate ChartBack in the olden days, before we all were wandering around with smart phones on our hips with apps like HVAC Toolkit on them, if we needed to figure out the pressure drop in a pipe or duct, we would use a chart. We entered it with the flow rate and line size of interest, and then graphically read a friction rate for those conditions. Or we might enter it with a maximum friction rate we could tolerate and a flow rate we needed to deliver and graphically determine the line size required.
|
Sometimes, using that approach is still handy. For one thing, it helps you visualize where your operating point is relative to other flow rates, line sizes and design limits. And, if you are just learning to do it, then the chart approach forces you to understand the fundamental principles a bit more than using a slider on a smart phone screen will.
This spreadsheet is a tool I put together a while back to support an interactive exercise in a class were students were estimating the pump head required for a system they were working with. Its not highly automated but it does include a pipe friction chart for iron pipe and lets you manually make a piping selection by entering the flow rate you are interested in and then manipulating a line on the chart to determine a line size that will give you a workable friction rate.
This spreadsheet is a tool I put together a while back to support an interactive exercise in a class were students were estimating the pump head required for a system they were working with. Its not highly automated but it does include a pipe friction chart for iron pipe and lets you manually make a piping selection by entering the flow rate you are interested in and then manipulating a line on the chart to determine a line size that will give you a workable friction rate.
| Pipe Friction Rate Chart (pipe_friction_chart_vblog.xlsx) |

