A Field Perspective on Engineering Commissioning Resources
  • Home
    • What's New
  • Blog
    • Blog Support
  • SketchUp Models
    • SketchUp Resources
    • Bureaucratic Affairs Building HHW System Logic Exercise
    • Bureaucratic Affairs Building Scavenger Hunt
    • Chilled Water Plant System Diagram Exercise
    • The HIjend Hotel >
      • Chilled Water Plant Scoping Exercise
      • Ballroom AHU Scoping Exercise
      • Cooling Tower Scoping Exercise
  • Tools
    • Altitude Correction Factor
    • Economizer Evaluation Checklist
    • Eikon for Educators and WindLGC
    • Effective Duct Length Tool
    • Excel Third Axis Tool
    • Excel Time Value Conversion
    • Insulation Savings Tools
    • Logic Diagram Tool
    • Mixed Air Calculations
    • Monitoring Plan Spreadsheet
    • Pipe Friction Chart
    • Plot Digitizer >
      • Plot Digitizer Pump Curve Example
    • Square Law Spreadsheet
    • System Diagram Symbols
    • Thermodynamic Diagrams Spreadsheet
    • Universal Translator Data Analysis Tool
    • y = (m * x) + b Spreadsheet
  • Useful Formulas
    • Affinity Laws
    • Circular Equivalent Duct
    • Effective Duct Length
    • FT Guide Appendix C
    • HVAC Equations and Concepts
    • Hydraulic Diameter
    • Pump Power and Energy
    • "Square Law"
  • What's That Thing?
    • Cooling Towers
    • Pumps
    • Valves
  • Resources
    • Bill Coad's Writings
    • Data Logging Resources
    • EBCx Skills Guidebook
    • Energy Design Resources
    • Fisher Controls Valve Cavitation Bulletin
    • Functional Testing Guide
    • Honeywell Gray Manual
    • MCC Powers Bulletins
    • NBCIP Reports
    • PEC Tool Lending Library
    • PID Resources
    • Pneumatic Control Resources
    • Resource List
    • Scoping Resources
    • TAB Resources
    • Vintage Carrier Design Manual
    • VRF Systems
    • Williams' Wisdom
  • Videos
    • Bureaucratic Affairs HHW Logic Answers
    • Cooling Tower Flow Variation
    • Economizer Stratification
    • Functional Testing
    • Induction Principles
    • Monitoring Plans
    • Ripple Effects
    • Testing a Pump
    • The Garden of Low Entropy
    • Variable Flow Systems
  • Training
    • Materials from Classes and Presentations >
      • ACEEE
      • ASHRAE
      • ASHRAE - Engineers Notebook
      • BCxA and NCBC
      • BEST Institute
      • Case Studies
      • ERDC 2020 RCx Academy
      • ELPNW
      • ICEBO
      • Marriott AEP
      • Magazine Articles
      • NAVFAC
      • Pacific Energy Center Design, Performance and Commissioning Issues Classes >
        • PEC Class Materials Archive
      • Pacific Energy Center EBCx Project Review
      • Pacific Energy Center EBCx Workshop Series >
        • EBCx Workshop Series 12
        • EBCx Workshop Series 13
        • EBCx Workshop Series 14
        • EBCx Workshop Series 15 >
          • Student One On One Discussions
        • EBCx Workshop Series 16
        • EBCx Workshop Series 17
      • Portland General Electric
      • U of W >
        • U of W Archive
    • On Demand Training >
      • Fans, Ducts and AHUs
      • Induction Motor Principles
      • Introduction to Functional Testing
      • Scope of Work Documents
    • Training Opportunities
  • Contact
    • Copyright and Permissions

Excel Third Axis Tool

Picture
 Frequently, I find myself wanting to compare three or more data sets in an Excel chart that have widely different ranges and orders of magnitude or both.  Because (as far as I know) Excel only provides two axes, you can run into an issue in that if you set those axes up to make two of the data series visible, then the third data series is either a flat line or off the scale on either axis.

Before I came up with a way to create a third axis, I would use a scaling factor with the data set I could not fit on another axis and then call out the scaling factor in the data set name.  For instance, if I had to divide air flow by 1,000 to get it to show up in a meaningful way on a chart that was also displaying air system temperatures and air system static pressures, I would label the air flow axis as "Air Flow/1,000" or "Air Flow Divided by 1,000".

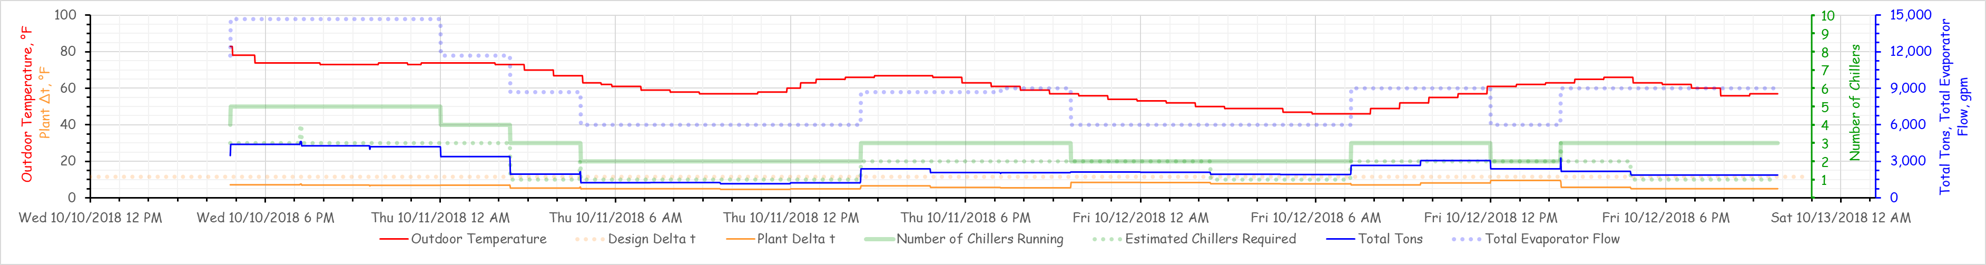
But at some point, I realized that I could create a special axis by plotting a data series so that it showed up as an appropriately scaled and located vertical line on the chart, just like the "Number of Chillers" axis in the chart above.  In reality, the data is still being scaled and plotted against one of the other axes.  But the "third axis" gives you a way to read the data directly with out having to do some extra math, so it seems cleaner, at least to me.

This spreadsheet contains the set-up I use to do that.   The data in it is a simple example I set up to support the blog post I wrote about how to go about creating a third axis.  But you could take this spreadsheet and insert it as a tab in a working spreadsheet that you have and rework some of the formulas and references to point to the data you wanted to plot on your third axis instead of the example data set and it would potentially save you from "reinventing the wheel".  I use it that way myself.

Or, you may just want to download it along with a copy of the basic data set so you can follow along and learn the technique by doing it as you read through my Creating a Third Axis in Excel Blog post.  The file on the left is the full spreadsheet tool, including the data set which would allow you to just run with it or reverse engineer it. The file to the right is the basic data set, which would let you start from scratch and build the tool as you read through the associated blog post.
third_axis_tool_vweb_v2.xlsx
File Size: 119 kb
File Type: xlsx
Download File

example_data_set.xlsx
File Size: 13 kb
File Type: xlsx
Download File

Home

Blog

Resources

Contact

Picture
A Field Perspective on Engineering - © 2017 Facility Dynamics Engineering, All Rights Reserved
(Contact Me to Check on Lefts or Any Other Questions You May Have about Permissions)