The Square Law
|
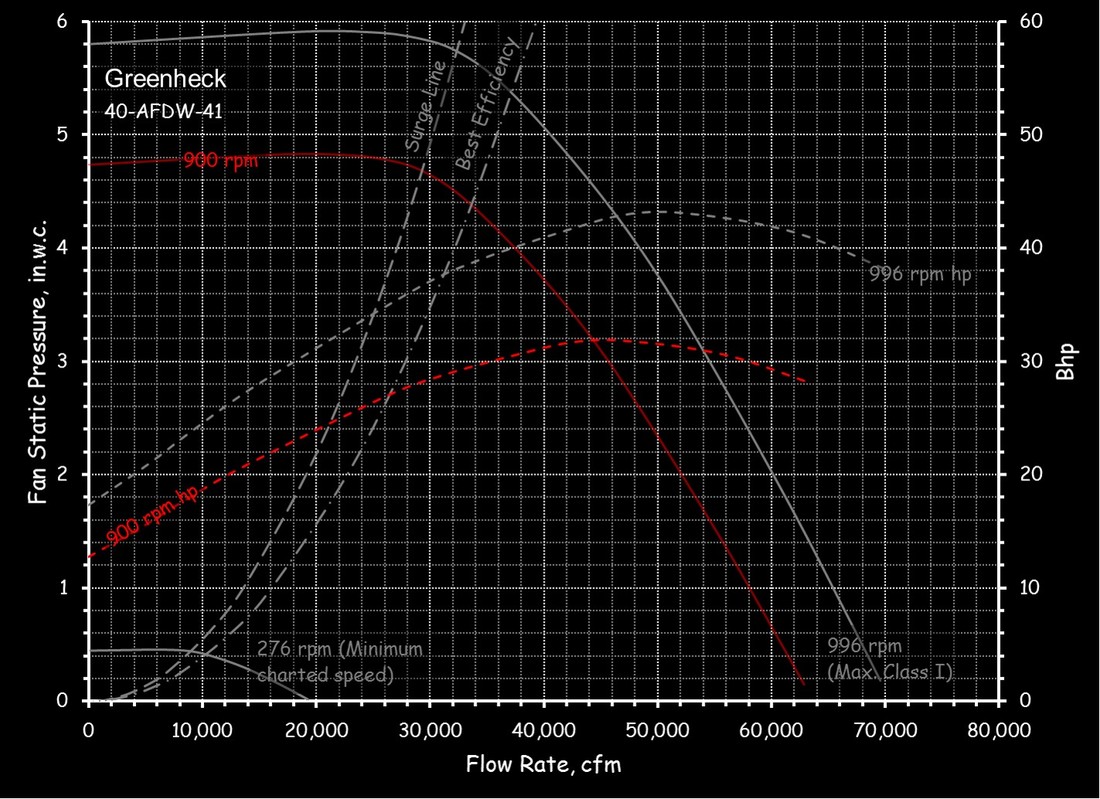
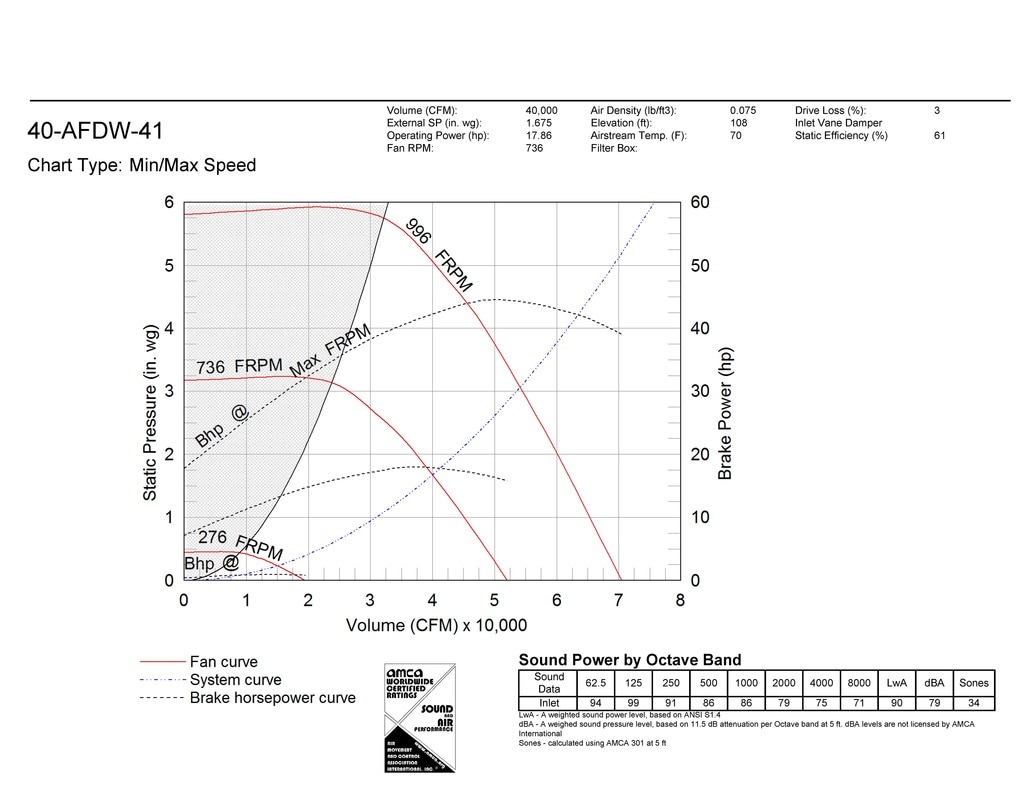
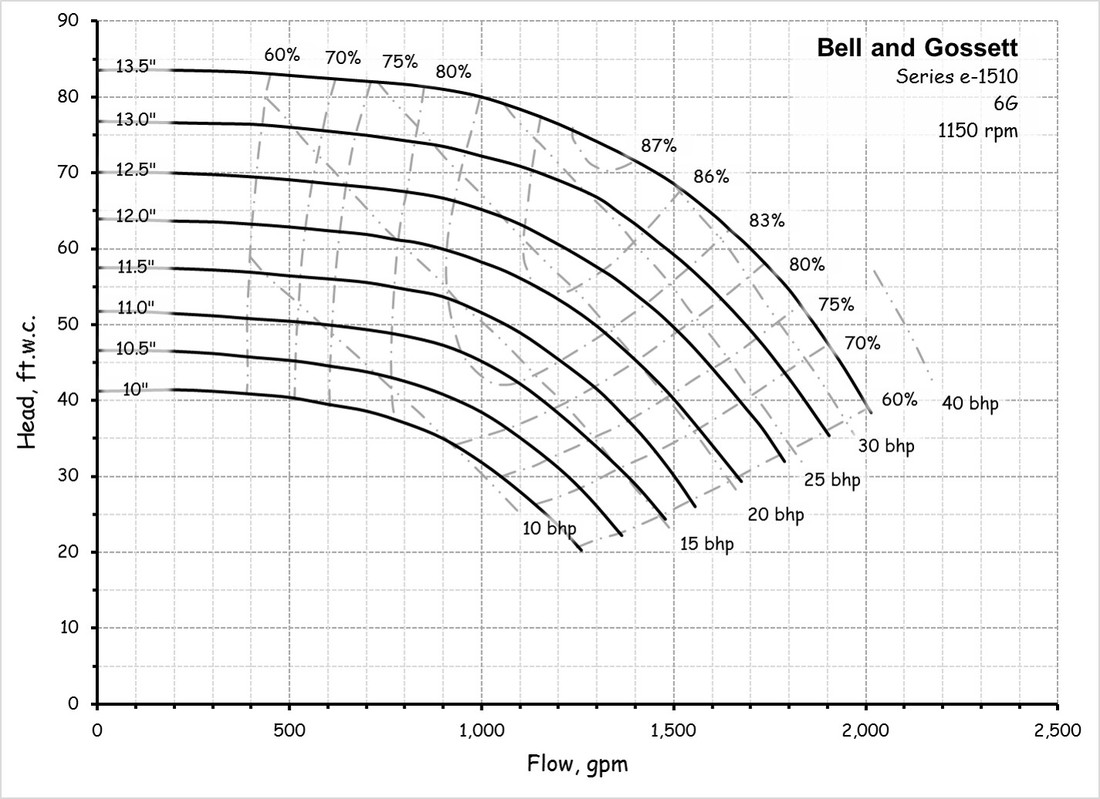
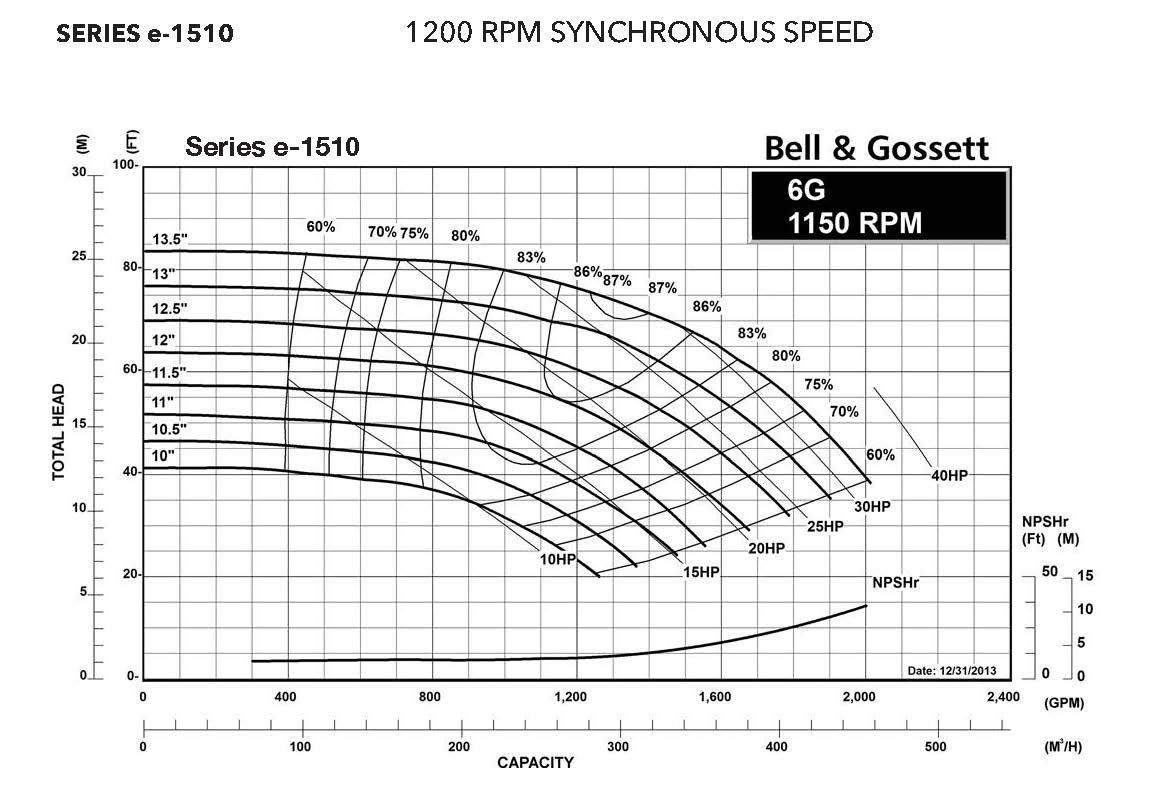
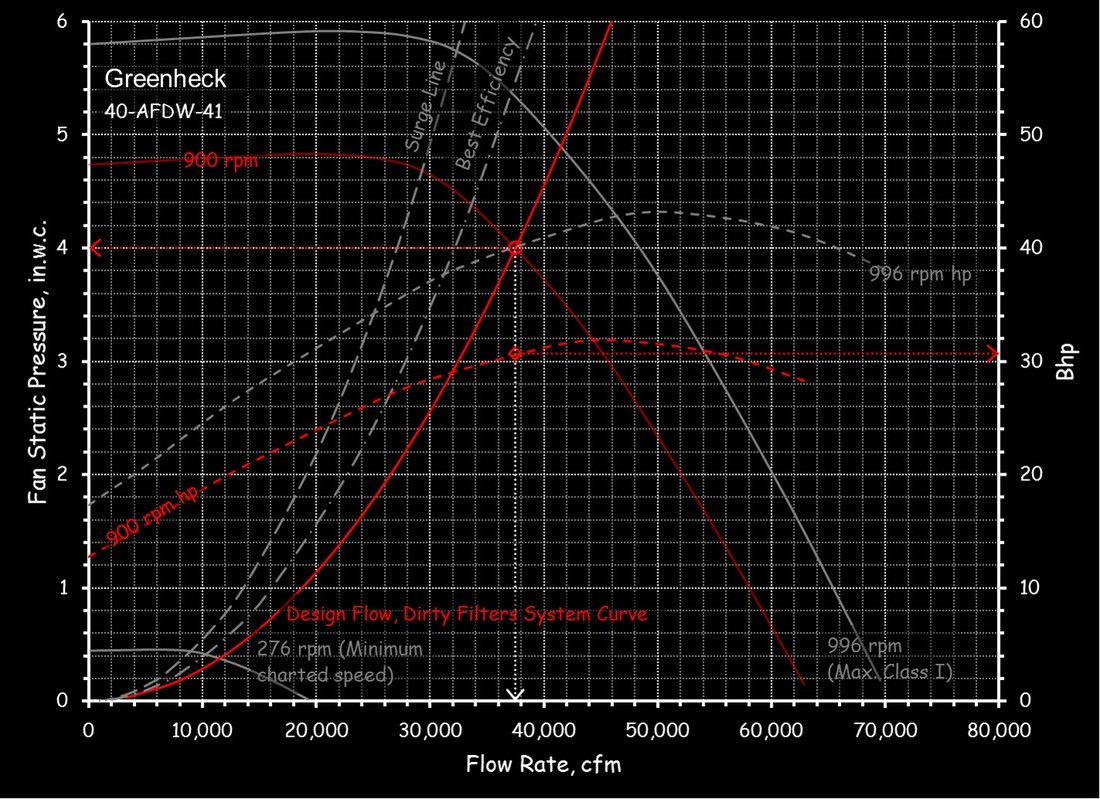
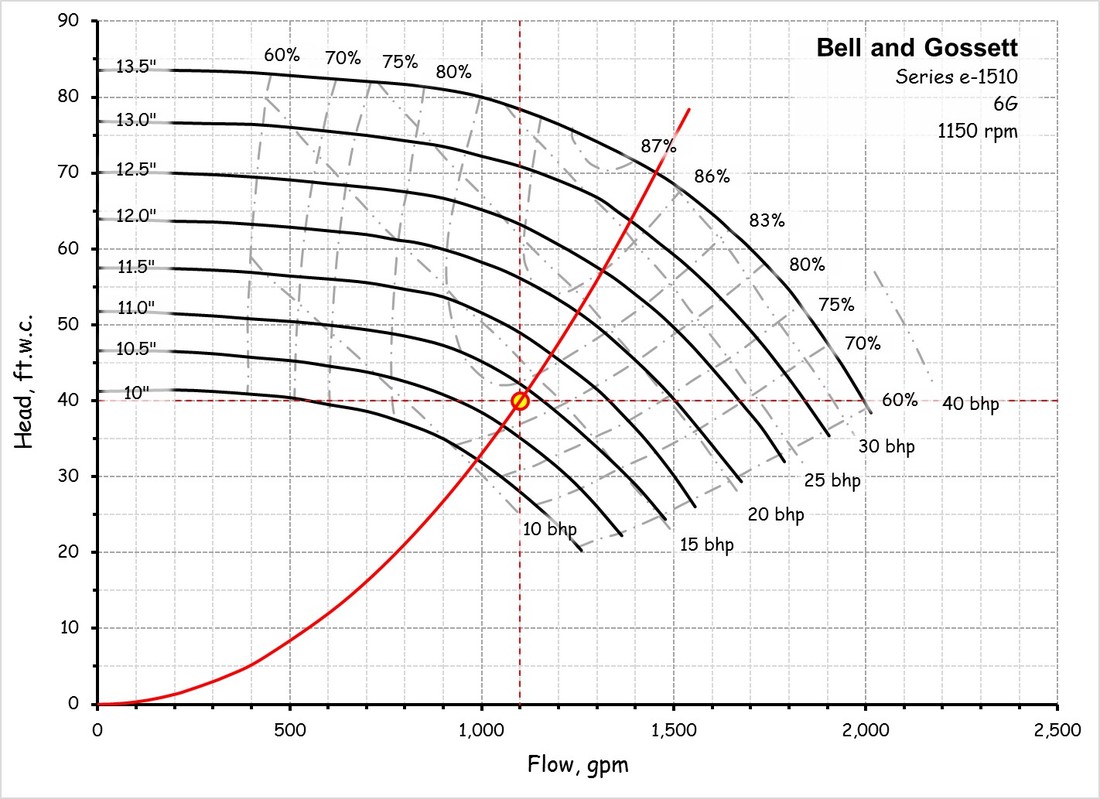
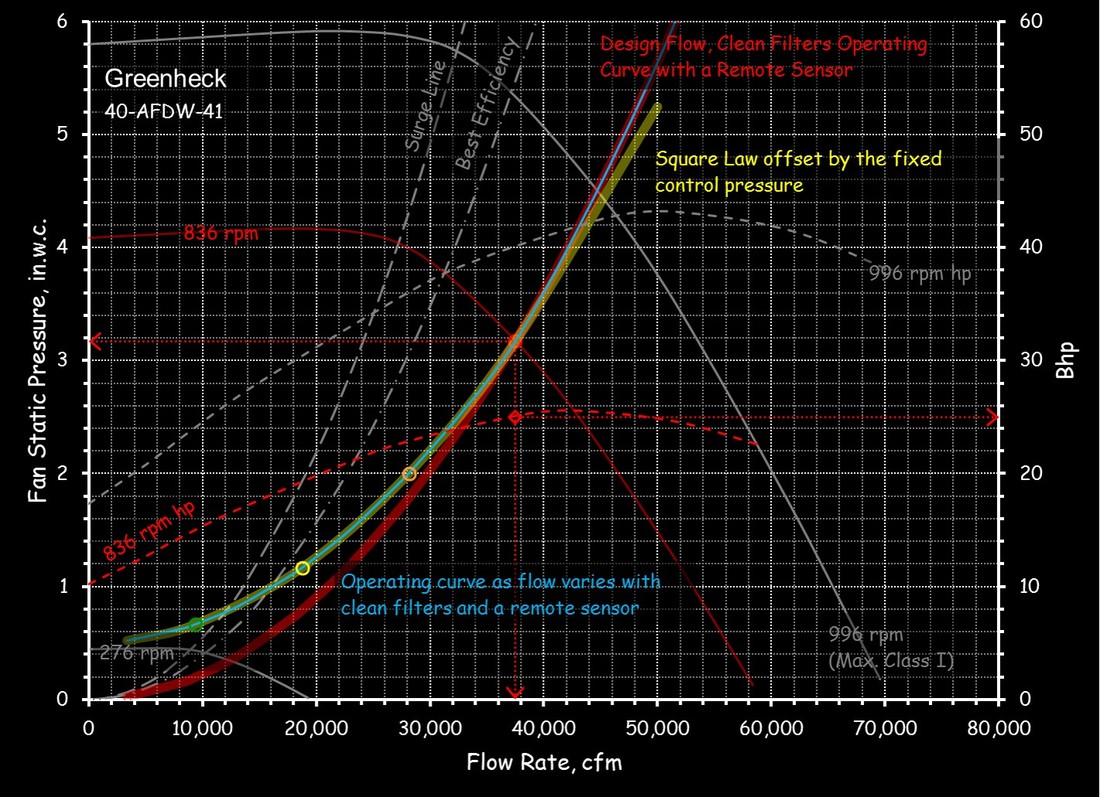
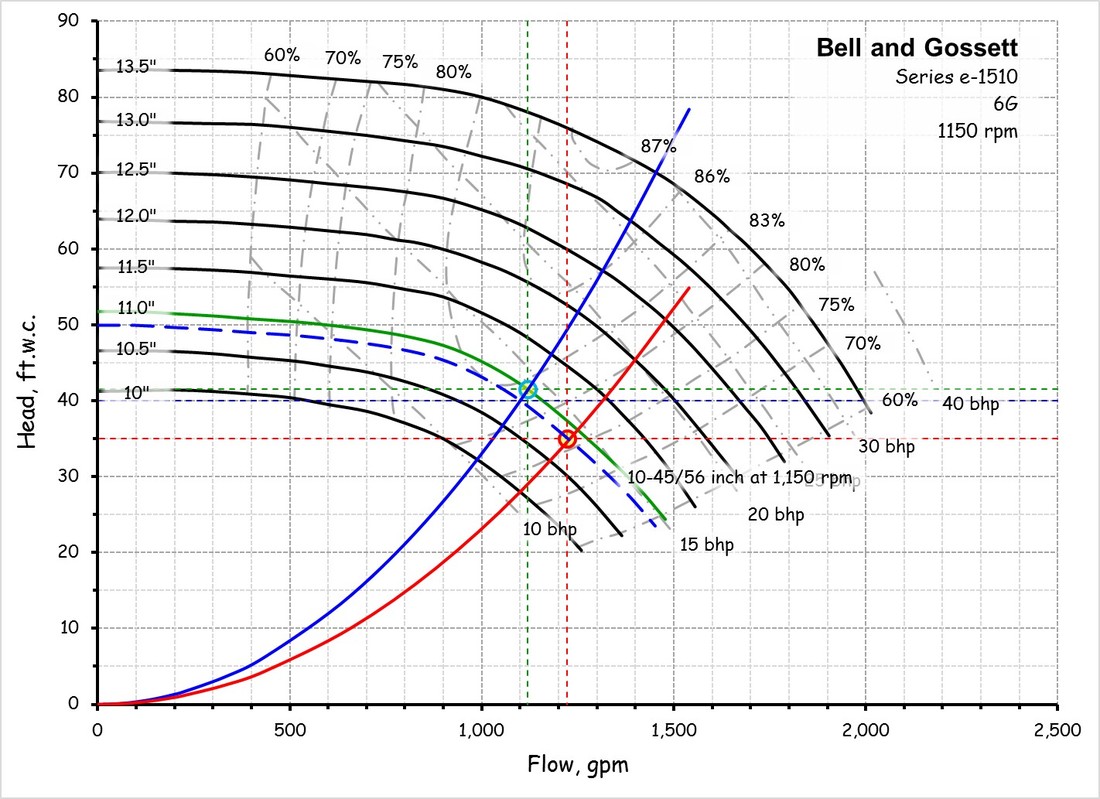
Fan and pump curves are a statement of a fan or pump's performance in terms of the flow and head or pressure that will be delivered by a given piece of equipment with a given impeller design and a given impeller diameter operating at a given speed. The shape of the curve is very specific to the physical characteristics of the fan or pump and the details of it's design. And, while a designer likely anticipates the shape of the curve for a fan or pump they are designing, the published curves are based on factory tests under conditions dictated by industry standards. The image to the left is an example of a fan curve and the one to the right is an example of a pump curve. Both of them are charts in Excel that were created from an image of the manufacturer's curve using Plot Digitizer. The images that were digitized to create them are also show below the digitized versions for comparison.
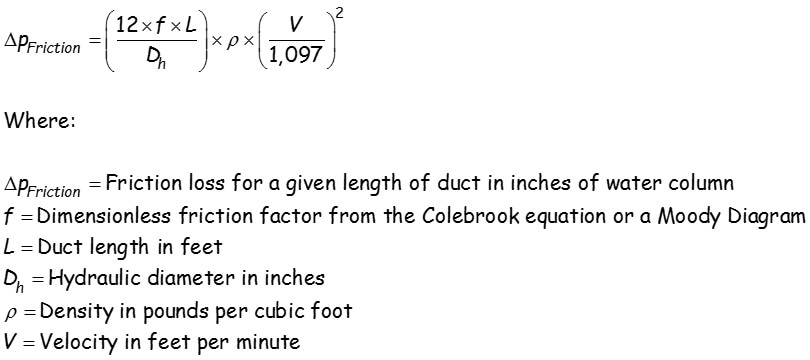
Systems curves are a statement of a piping network's performance in terms of the head required to produce a given flow rate. Their shape is very specific to the physical characteristics of the piping network; the distances, diameter of the pipe, the number and type of fittings, etc. The shape of the curve is a bit more predictable since it falls out of a fundamental physical relationship called the Darcy Weisbach equation.
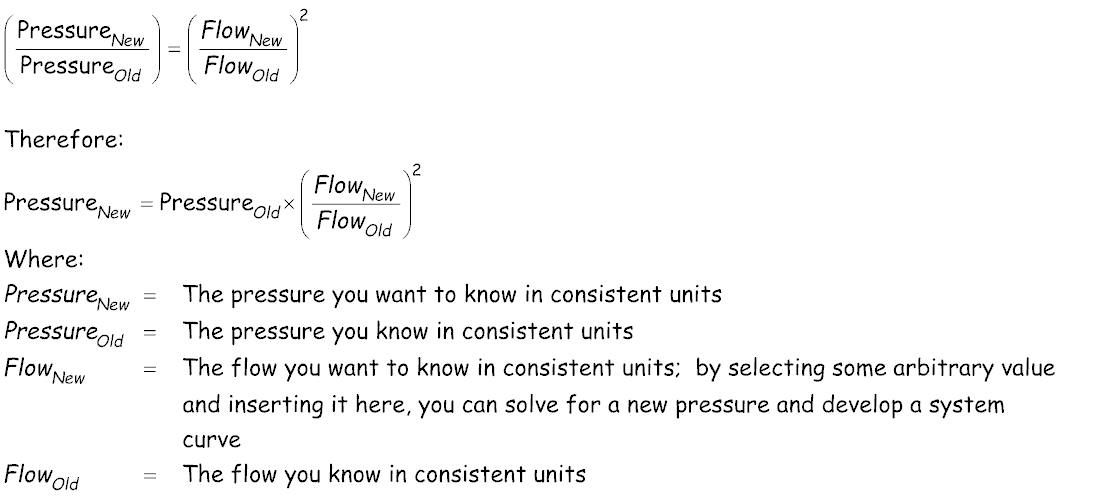
That looks a little scary, but fortunately, the square law that falls out of it is much less scary.
If you are working with pumps or fans, one of the things that is very useful is to realize that if you plot the system curve for your system on the fan or pump curve for the fan or pump that is serving it, the point where those two lines cross is the operating point for the fan or pump serving that particular system in that particular configuration.
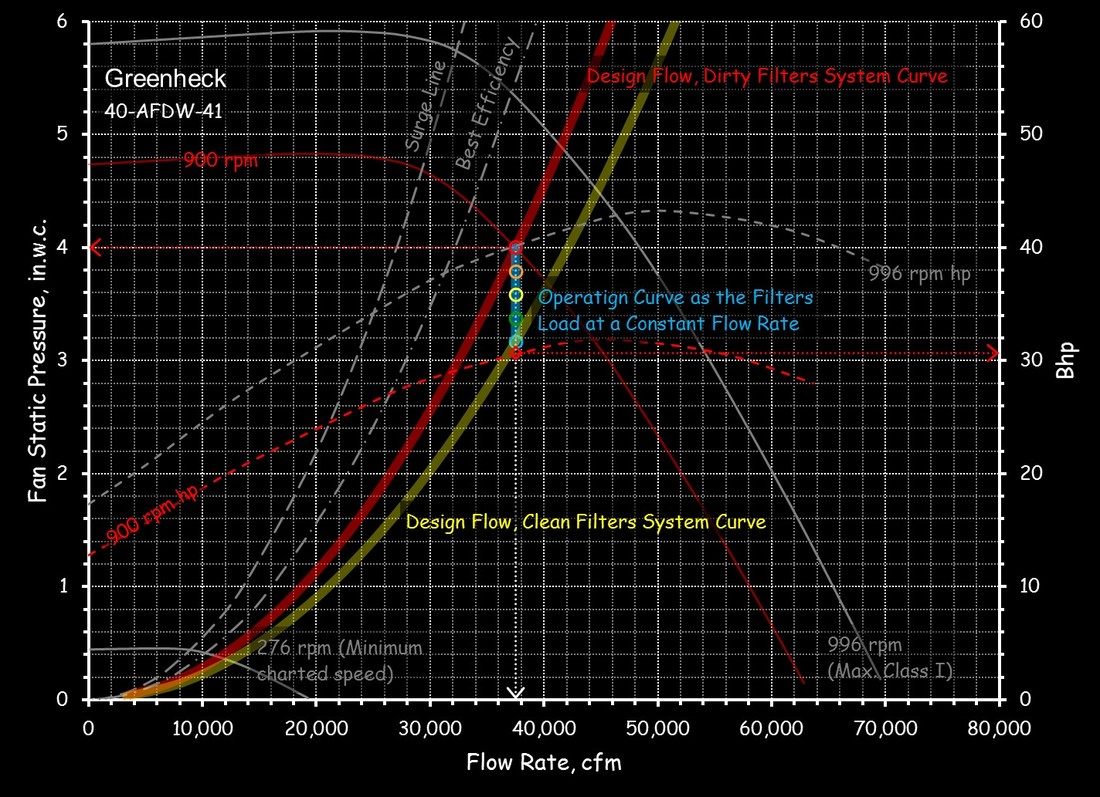
For example, the left illustration shows the system curve for a Greenheck 40-AFDW-41 fan operating at 37,500 cfm and 4 in.w.c. of static pressure. The right illustration shows the system curve for a Bell and Gossett Series e-1510 6G operating at 1,100 gpm and 40 ft.w.c., which incidentally, indicates that a non-standard impeller size will be required to deliver that condition since the operating point is not exactly on any of the standard impeller size lines. (You can use a pump affinity law to predict the impeller size you need, which is a separate discussion.)
For example, the left illustration shows the system curve for a Greenheck 40-AFDW-41 fan operating at 37,500 cfm and 4 in.w.c. of static pressure. The right illustration shows the system curve for a Bell and Gossett Series e-1510 6G operating at 1,100 gpm and 40 ft.w.c., which incidentally, indicates that a non-standard impeller size will be required to deliver that condition since the operating point is not exactly on any of the standard impeller size lines. (You can use a pump affinity law to predict the impeller size you need, which is a separate discussion.)
The Square Law Applies to a Fixed System
When applying the square law, there are a few things you could take into consideration to use it properly. One is that the square law applies to what is called a "fixed system"; i.e. a system were all of the dampers and valves are in a fixed position and the fan or pump is operating at a fixed speed. If something changes out in the system, for example:
In practical terms, that means that a water system with three way control valves serving the loads or the furnace in your house will tend to operate as fixed systems. I used the phrase "will tend to operate " because if:
- The economizer dampers modulate in an air system, or
- A control valve moves in a water system, or
- A balancing damper in an air system is adjusted, or
- A balancing valve in a water system is adjusted,
In practical terms, that means that a water system with three way control valves serving the loads or the furnace in your house will tend to operate as fixed systems. I used the phrase "will tend to operate " because if:
- The piping connected to the bypass associated with a three way valve is not balanced to have a pressure drop similar to the pressure drop of the coil served by the valve, or
- A three way valve is not properly sized, or
- The filter in your furnace starts to load up,
The Square Law and the Darcy Weisbach Equation
The square law has its roots in the Darcy Weisbach equation as mentioned previously. That relationship assumes fully developed turbulent flow. While that is generally true for our systems, it is not always true. For instance:
Having said that, even in the pressurized, completely full pipes and ducts found in HVAC systems, there can be some places and/or operating conditions where the flow will not be fully developed turbulent flow. For example, in a filter or strainer, where the cross sectional area may increase relative to the duct or pipe serving it, the flow may actually be laminar or in transition from turbulent to laminar, even at design conditions. Or in a tube in a coil or a duct run where the flow varies, there may be a load condition below which the flow transitions from fully developed turbulent flow to laminar flow.
- The flow of water in the gutters on your house, or
- The flow of condensate in the condensate return line from a steam load, or
- The flow in a sewer that is not full of water and pressurized
Having said that, even in the pressurized, completely full pipes and ducts found in HVAC systems, there can be some places and/or operating conditions where the flow will not be fully developed turbulent flow. For example, in a filter or strainer, where the cross sectional area may increase relative to the duct or pipe serving it, the flow may actually be laminar or in transition from turbulent to laminar, even at design conditions. Or in a tube in a coil or a duct run where the flow varies, there may be a load condition below which the flow transitions from fully developed turbulent flow to laminar flow.
Open and Closed Systems
|
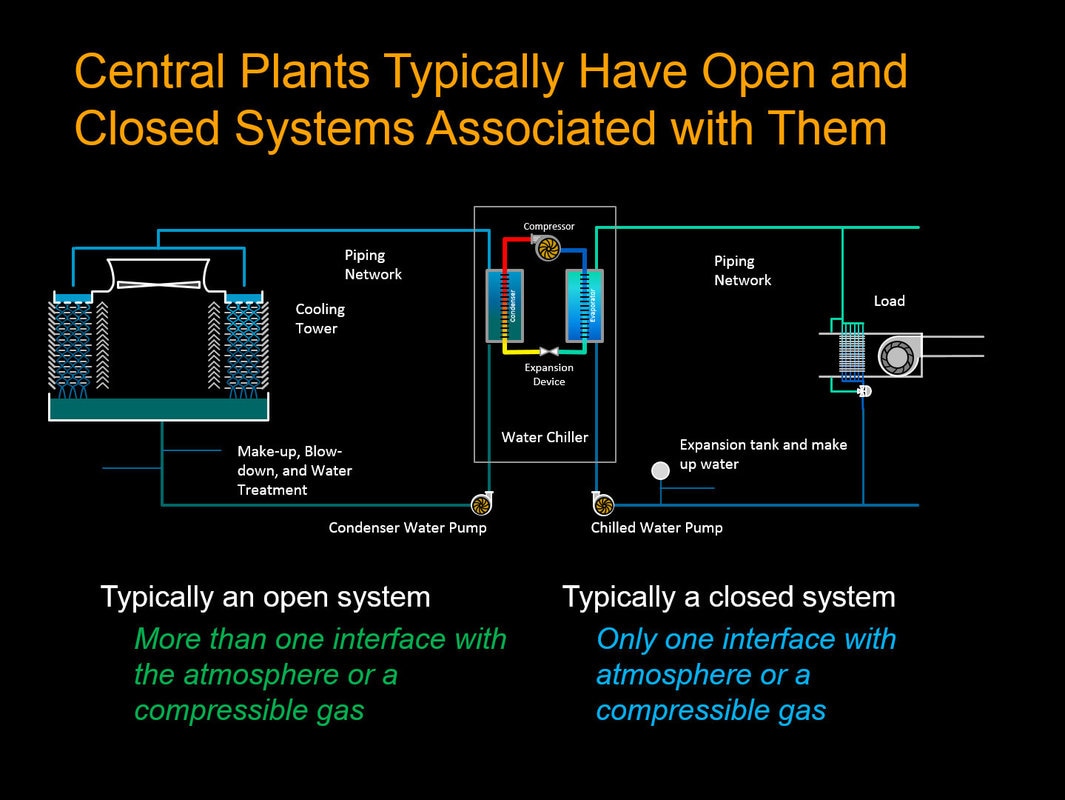
There are two general classes of piping systems typically encountered in buildings, open systems and closed systems. The images to the left are slides that I use when I talk about this in a classroom setting and, as you can see, the piping network associated with most cooling towers is an open system where-as the piping network associated with most chilled water systems is a closed system.
The defining difference is that an open systm will have more than one place where the water it contains comes into contact with the atmosphere or a compressible gas. For example, in a cooling tower the water meets up with atmospheric pressure at the hot basins or spray nozzels and falls through an elevation change in the tower to be collected in the cold basin, which is also open to atmosphere. |
In contrast, the water in a chilled water system typically only sees a compressible gas like air in the expansion tank. The expansion tank itself is usually closed and pressurized, but in some facilities, it can be an open tank located at the high point in the system.
That is not to say that there are not closed condenser water systems and open chilled water systems. For example, there are cooling towers that actually have a coil in them that contains the condenser water and then a separate piping loop that is used to spray water over the coil and cool it, primarily by evaporation. In this case, the actual condenser water circuit is a closed circuit and the pump spraying water over the coil is an open circuit.
In terms of chilled water systems, there are thermal storage applications where chilled water is stored in an open tank with the supply pipe dumping the water into the tank from above the water surface and a pump pulling water out of the tank from below the surface of the water in the tank. An application like that would be an open system. Air washers, where chilled water is sprayed into the air stream to both cool and dehumidify it are also examples of open chilled water systems.
|
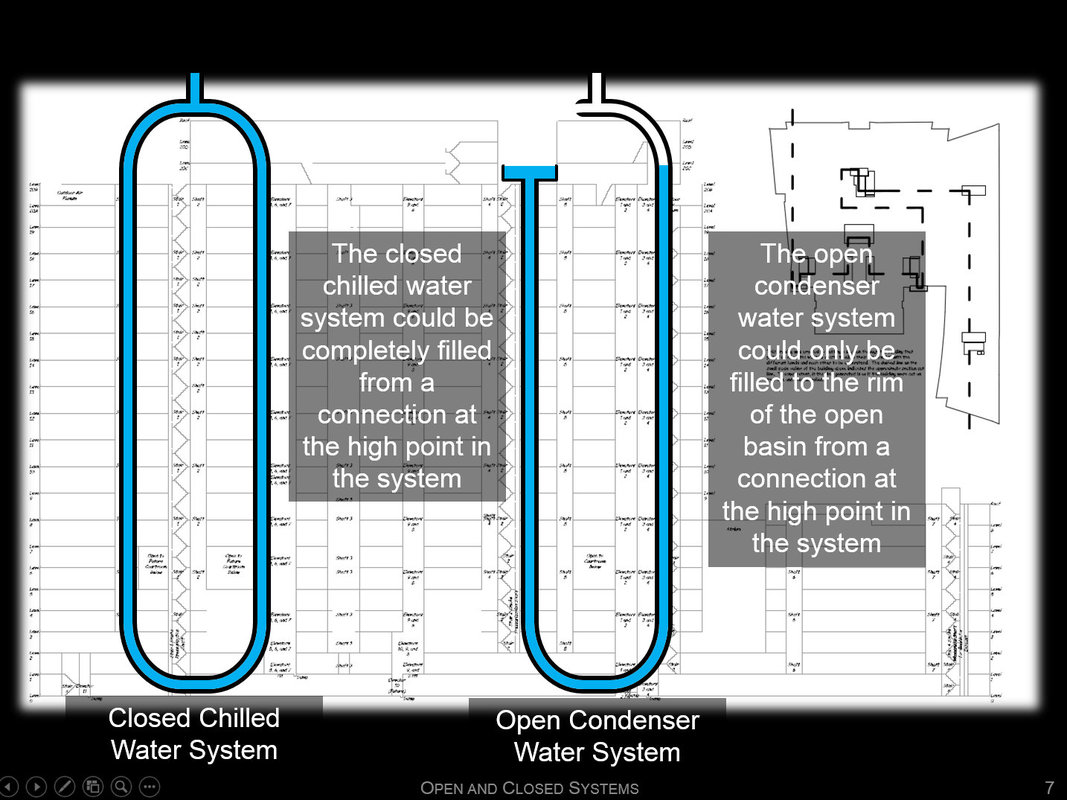
Another way to understand the difference between the two types of systems is to imagine you are on the roof with a hose and need to fill them up. You could completely fill the closed system through a tee at the high point in the system. Even if the building was hundreds of feet tall, the weight of the water you put into the pipe going down on one side of the building would push water back up in the pipe on the other side.
In contrast, if you tried to completely fill the cooling tower system through a tee in the high point or the open cold water basin. you could only fill the pipe up to the water level in the open basin. After that, the water you tried to add would just overflow out of the basin instead of filling the pipe to the high point. |
The elevation difference between the water level in the tower basin and the outlet opening at the top of the piping system is called the "lift" of the tower because if you wanted to circulate water in the loop, then, in addition to having enough pressure capability to overcome the resistance due to flow that would occur as the water moved through the pipe, the pump would also need to have enough pressure capability to lift the water through the elevation difference between the outlet at the top of the tower and the water level in the basin.
In contrast, a pump in the closed system would only need to have enough pressure capability to overcome the resistance due to flow in the piping circuit, even if the building was hundreds of feet tall. That is because the weight of the water on one side of the piping loop would push water up the other side.
In contrast, a pump in the closed system would only need to have enough pressure capability to overcome the resistance due to flow in the piping circuit, even if the building was hundreds of feet tall. That is because the weight of the water on one side of the piping loop would push water up the other side.
The Square Law and Open Systems
If you did a little thought experiment that involved an open system with a pump that was equipped with a variable speed drive of some sort and that you start with the pump at zero rpm and gradually increased the pump's speed, you can probably see that until the pump was spinning fast enough to produce a discharge pressure that was equal to the weight of the water in the portion of the pipe above the tower basin, there would be no flow. That means that for open systems, the system curve does not go through zero gpm at zero feet of head. Rather, it goes through the zero gpm point at the pressure equal to the lift of the tower.
For example if the lift on a tower was 10 ft.w.c., then the system curve would start at 0 gpm at 10 feet of water column. And if you repeat the little thought experiment at the beginning of this section, you will probably see that in that system, there would be no flow as you increased the pump speed until the speed of rotation produced 10 ft. w.c. of pressure. Then flow would begin to occur and the relationship between flow and the pressure required to produce it would be predictable by the square law.
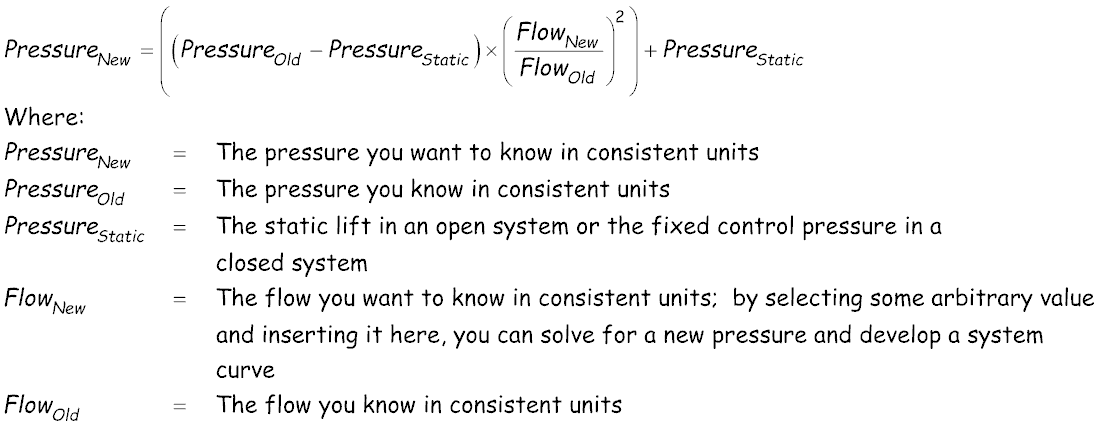
That means if you want to calculate the system curve for an open system, you need to do the calculation only on the portion of the head that will result in the circulation of water. So, if in our example, the system required 10 ft.w.c. to lift water over the tower and another 20 ft.w.c. to circulate the water, we would need a pump rated for the design flow rate at 30 ft.w.c. But we would only calculate the system curve based on the 20 ft.w.c. that produced flow, with the formula looking like what is shown below.
The Square Law and Closed Systems
It is fairly common for building systems to be controlled to either maintain a fixed pressure at some point in the system or a fixed flow rate. For example, may variable flow pumping systems and fan systems are controlled for a fixed pressure at some point down stream of the pump or fan as control valves or dampers open and close in response to changes in the loads they are associated with. Similarly, a constant volume fan or pumping system might be controlled to ensure a constant volume is maintained even thought filters are accumulating debris and requiring more pressure to maintain the steady flow rate.
There are a number of different control strategies that are used to accomplish system operating profiles of this type and the result can be a condition where the system develops some measure of pressure even though their is no meaningful flow being produced. But it is important to realize that while similar to the phenomenon described above, there is a subtle but significant difference. For the phenomenon described for the open system, initially, there was no flow and thus no pressure drop due to flow, a condition that persisted until the pump produced enough pressure to lift water over the cooling tower and trigger flow after which the pressure required to produce the flow was a function of the square of the flow rate. There was no change in the system that caused the flow to cease when the pressure dropped below the lift of the tower and the piping system was a fixed system.
In contrast, the situations described at the beginning of this section all are associated with systems that are not fixed systems;
But, since the systems are being controlled to force a required level of performance, either steady flow as things change or a fixed pressure as things changed, then, if you plotted the points associated with each operating condition you will either get a straight vertical line at a constant flow rate for systems controlling for a constant flow as shown in the image to the left below or a family of curves that are not pure parabola's (the name for a curve that is generated by a y is a function of x squared type relationship) that would go through zero cfm at the targeted fixed operating pressure, as illustrated in the image to the right.
There are a number of different control strategies that are used to accomplish system operating profiles of this type and the result can be a condition where the system develops some measure of pressure even though their is no meaningful flow being produced. But it is important to realize that while similar to the phenomenon described above, there is a subtle but significant difference. For the phenomenon described for the open system, initially, there was no flow and thus no pressure drop due to flow, a condition that persisted until the pump produced enough pressure to lift water over the cooling tower and trigger flow after which the pressure required to produce the flow was a function of the square of the flow rate. There was no change in the system that caused the flow to cease when the pressure dropped below the lift of the tower and the piping system was a fixed system.
In contrast, the situations described at the beginning of this section all are associated with systems that are not fixed systems;
- When a valve or a damper moves in a variable flow system, it creates a new system curve, which, if the pump or fan speed remains constant, will cause the flow to change, which generally is the desired result all though the result can be optimized by slowing the pump or fan down once the new operating condition is established.
- When a filter loads in a constant flow system, it creates a new system curve which will cause the flow to change, but this is not the desired result so the pump or fan performance needs to be changed by adjusting its speed to maintain the desired constant flow.
But, since the systems are being controlled to force a required level of performance, either steady flow as things change or a fixed pressure as things changed, then, if you plotted the points associated with each operating condition you will either get a straight vertical line at a constant flow rate for systems controlling for a constant flow as shown in the image to the left below or a family of curves that are not pure parabola's (the name for a curve that is generated by a y is a function of x squared type relationship) that would go through zero cfm at the targeted fixed operating pressure, as illustrated in the image to the right.
For the variable flow system (right illustration) the industry convention is to assume the operating curve is a parabola that passes through a flow rate of zero at the fixed operating pressure set point. While that is generally true, it is not totally true as can be seen from the illustration. But for most operating conditions, assuming a parabola through zero cfm at the fixed operating pressure is a reasonable assumption. This is what you would project if you used the version of the square law associated with an open system that was provided at the end of the previous section.
Applying the Square Law to Understand Pump and Fan Performance
In a field situation or design situation, being familiar with the square law and how to apply it can be a very useful thing. For example, if you encountered a pump that had its discharge valve throttled, it is likely that the balancing contractor did that to return the pump to the design operating point because it turned out to have more head than necessary to achieve design flow in the "as installed system". The good news is that the throttling process probably saved some energy compared to not doing anything. But the bad news is that the pressure drop that is occurring through the throttled valve actually represents wasted energy relative to what would be required if you could achieve design flow with the valve wide open.
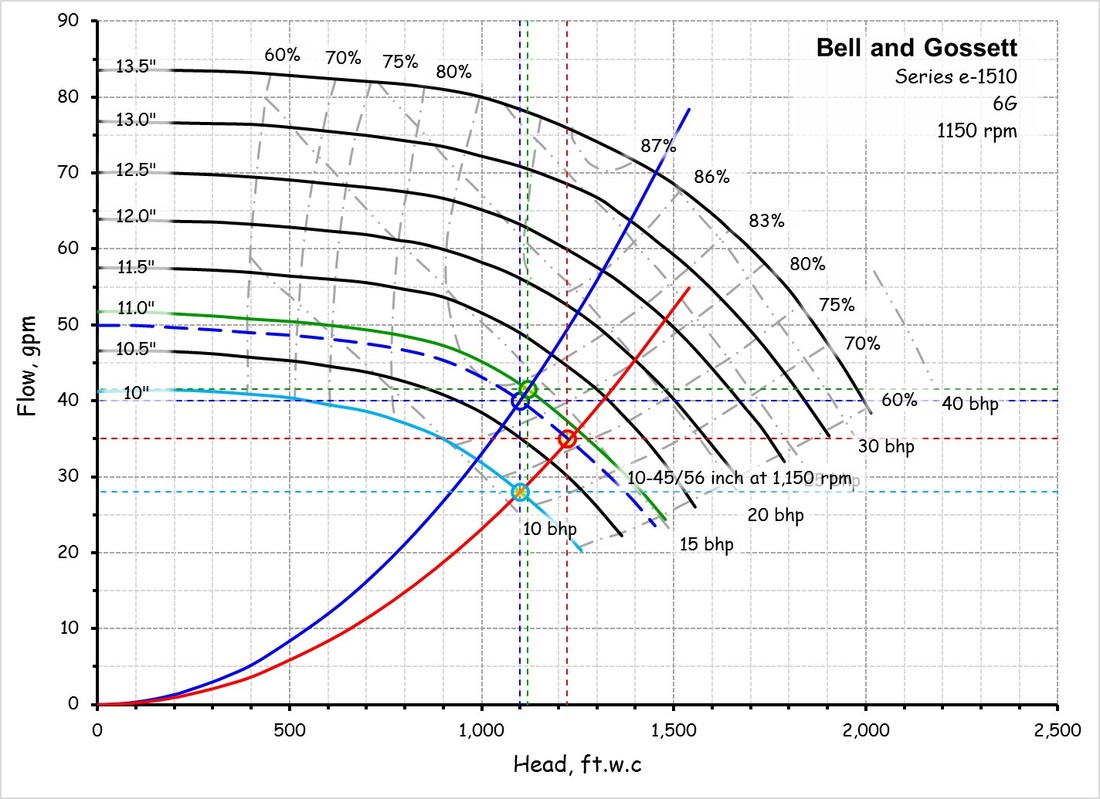
But there is still some good news; it turns out that you can use a pump curve, the square law and a field test to provide you with the information you need to assess the options. The illustration below and to the left shows the operating point and system curve for the design condition, along with the impeller size required to provide it. Since the pump turned out to be over-sized, the pump had to be throttled to return it to the design point.
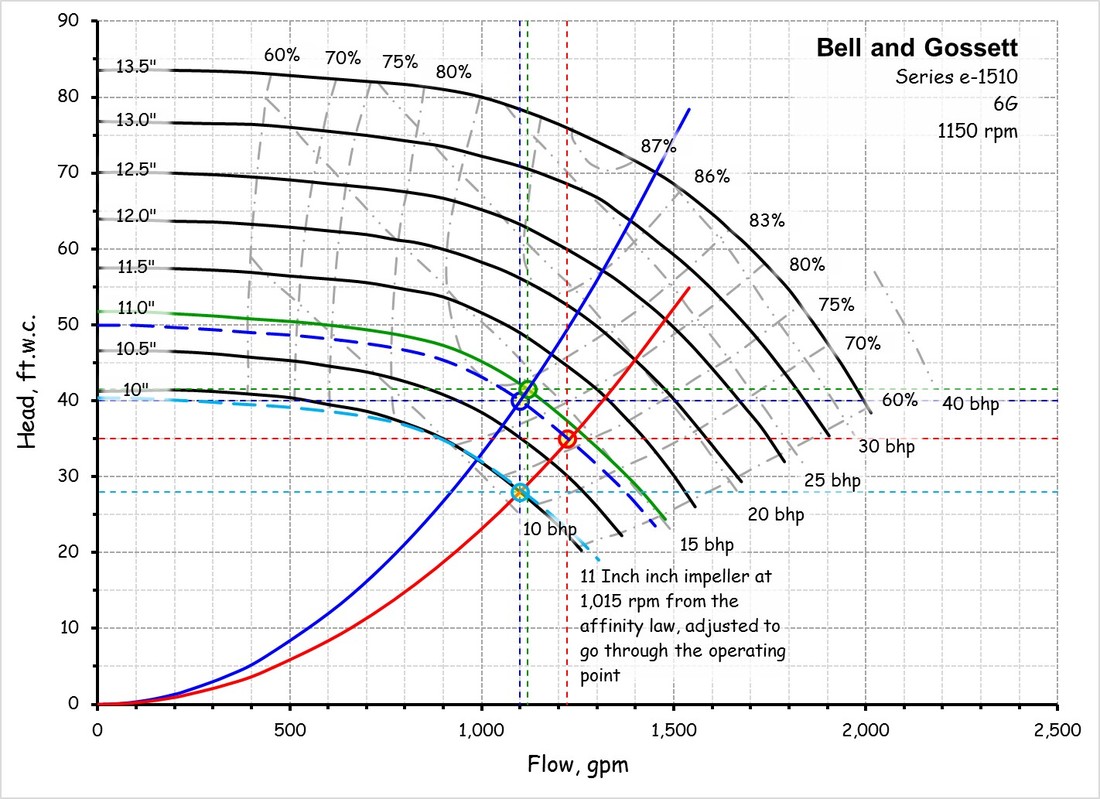
The illustration below and to the right shows the new operating point (the red circle) that was created when the valve was opened fully. The square law was then used to project the system curve for the new operating point on the pump curve, which then allows you to assess options for optimizing the pump, like trimming the impeller (shown in the images after the next section of text) or changing the pump speed (shown below).
In contrast to fixed systems (which also tend to be constant flow systems), variable flow systems (water systems with two way valves on the loads or air systems with flow regulation equipment at the terminal units for example) will actually operate on a family of system curves because each time a valve or damper moves, a new operating point and system curve will be created.
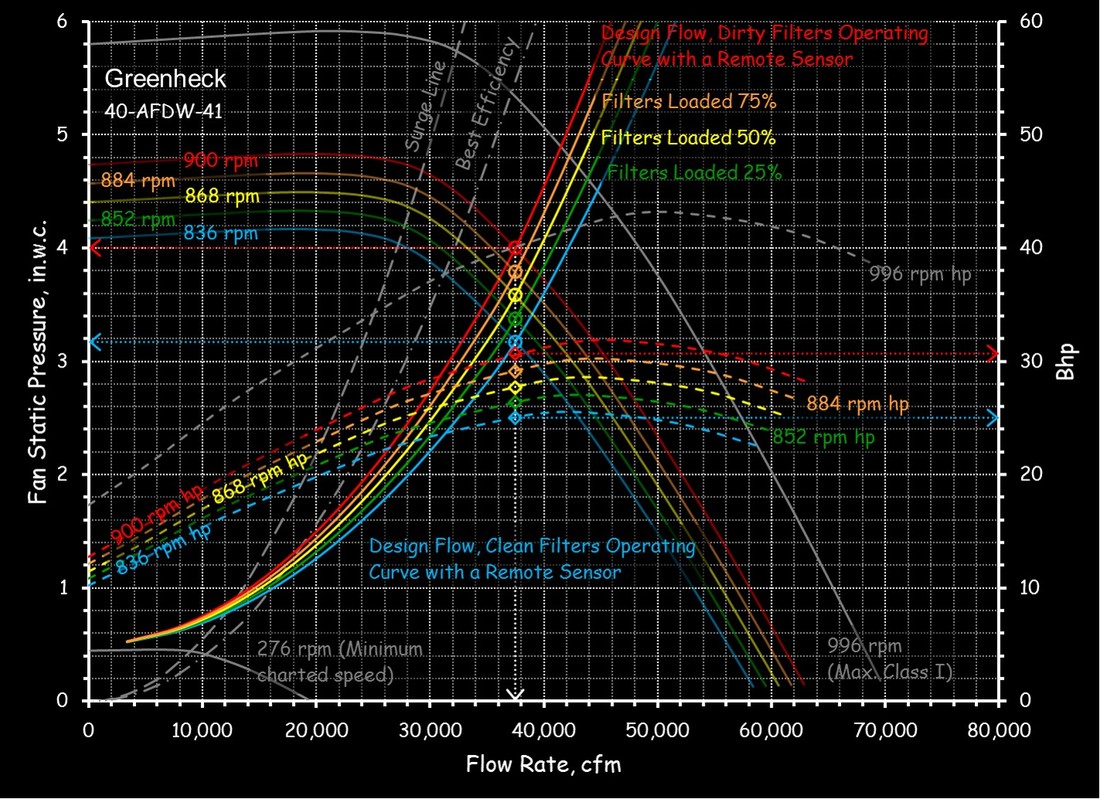
For example, the left illustration shows how the system curve for the Greenheck fan will change as the filters go from the pressure drop they will have when they are clean to the pressure drop they will have when they are dirty. Performing that analysis allows you to predict how the fan power for the system would vary as the filters loaded.
The right illustration shows the new system curve created for the Bell and Gossett pump example after the throttled valve on the discharge of the pump was opened. The new system curve allows you to assess various options for optimizing the pump so it would deliver design flow with the valve wide open, like changing its impeller size, which is what is shown below, or changing the pump's speed, which is what was illustrated above.
The bottom line is that by using the square law to project the system curve for various operation conditions in our systems and then plotting the results on the fan or pump curve for the equipment serving them, we can gain insight into how the systems will operate and what strategies we might want to employ to optimize their operation.
The downloads below will give you to the .wmf files for the Darcy Weisbach equation and the Square Law equation that I illustrated earlier in the post. You will also find the related information on the website to be helpful:
The downloads below will give you to the .wmf files for the Darcy Weisbach equation and the Square Law equation that I illustrated earlier in the post. You will also find the related information on the website to be helpful:
- A spreadsheet in the "Tools" page of the website that uses the square law to generate a system curve based on a known operating condition like the design point or an operating point gleaned from a field test.
- A spreadsheet in the "Tools" page of the website that provides a template for loading digitized data from Plot Digitizer into a spreadsheet to create electronic pump and fan curves like the ones I used in the illustrations on this page.
| Darcy Weisbach Equation (darcy_equation_for_friction_loss_in_duct_-_web.wmf) |
|
| ||||
