A Field Perspective on Engineering Commissioning Resources
  • Home
    • What's New
  • Blog
    • Blog Support
  • SketchUp Models
    • SketchUp Resources
    • Bureaucratic Affairs Building HHW System Logic Exercise
    • Bureaucratic Affairs Building Scavenger Hunt
    • Chilled Water Plant System Diagram Exercise
    • The HIjend Hotel >
      • Chilled Water Plant Scoping Exercise
      • Ballroom AHU Scoping Exercise
      • Cooling Tower Scoping Exercise
  • Tools
    • Altitude Correction Factor
    • Economizer Evaluation Checklist
    • Eikon for Educators and WindLGC
    • Effective Duct Length Tool
    • Excel Third Axis Tool
    • Excel Time Value Conversion
    • Insulation Savings Tools
    • Logic Diagram Tool
    • Mixed Air Calculations
    • Monitoring Plan Spreadsheet
    • Pipe Friction Chart
    • Plot Digitizer >
      • Plot Digitizer Pump Curve Example
    • Square Law Spreadsheet
    • System Diagram Symbols
    • Thermodynamic Diagrams Spreadsheet
    • Universal Translator Data Analysis Tool
    • y = (m * x) + b Spreadsheet
  • Useful Formulas
    • Affinity Laws
    • Circular Equivalent Duct
    • Effective Duct Length
    • FT Guide Appendix C
    • HVAC Equations and Concepts
    • Hydraulic Diameter
    • Pump Power and Energy
    • "Square Law"
  • What's That Thing?
    • Cooling Towers
    • Pumps
    • Valves
  • Resources
    • Bill Coad's Writings
    • Data Logging Resources
    • EBCx Skills Guidebook
    • Energy Design Resources
    • Fisher Controls Valve Cavitation Bulletin
    • Functional Testing Guide
    • Honeywell Gray Manual
    • MCC Powers Bulletins
    • NBCIP Reports
    • PEC Tool Lending Library
    • PID Resources
    • Pneumatic Control Resources
    • Resource List
    • Scoping Resources
    • TAB Resources
    • Vintage Carrier Design Manual
    • VRF Systems
    • Williams' Wisdom
  • Videos
    • Bureaucratic Affairs HHW Logic Answers
    • Cooling Tower Flow Variation
    • Economizer Stratification
    • Functional Testing
    • Induction Principles
    • Monitoring Plans
    • Ripple Effects
    • Testing a Pump
    • The Garden of Low Entropy
    • Variable Flow Systems
  • Training
    • Materials from Classes and Presentations >
      • ACEEE
      • ASHRAE
      • ASHRAE - Engineers Notebook
      • BCxA and NCBC
      • BEST Institute
      • Case Studies
      • ERDC 2020 RCx Academy
      • ELPNW
      • ICEBO
      • Marriott AEP
      • Magazine Articles
      • NAVFAC
      • Pacific Energy Center Design, Performance and Commissioning Issues Classes >
        • PEC Class Materials Archive
      • Pacific Energy Center EBCx Project Review
      • Pacific Energy Center EBCx Workshop Series >
        • EBCx Workshop Series 12
        • EBCx Workshop Series 13
        • EBCx Workshop Series 14
        • EBCx Workshop Series 15 >
          • Student One On One Discussions
        • EBCx Workshop Series 16
        • EBCx Workshop Series 17
      • Portland General Electric
      • U of W >
        • U of W Archive
    • On Demand Training >
      • Fans, Ducts and AHUs
      • Induction Motor Principles
      • Introduction to Functional Testing
      • Scope of Work Documents
    • Training Opportunities
  • Contact
    • Copyright and Permissions

Marriott 2018/2019 AEP Class

The following links will let you download the class presentations along with other materials like SketchUp Models, spreadsheets and other supplemental information that we use in class to illustrate a point or for an interactive exercises.   I will also post any materials we develop or reference during the class each day after class in a follow-up folder for the day.

For the Webinars, I will typically put the slides for a session up on this page sometime the day before the session or early in the morning of the session.  

June 11, 2019 Resources

Picture
The zip file below contains all of the information I will be using in the Capstone technical session, including the models.  I will also upload any follow-up information to this location after class.
2019-08-13_capstone_materials.zip
File Size: 36438 kb
File Type: zip
Download File

2019-08-13_follow_up.zip
File Size: 3507 kb
File Type: zip
Download File

June 11, 2019 Resources

Picture
variable_flow_water_plants.zip
File Size: 11705 kb
File Type: zip
Download File

Variable Flow Plant Information

A number of people who have been through Sabastian's  lab rotation have asked for copies of some of the slides that he had, which are from a set of slides I put together on Variable Flow plants a while back.    I thought I had given them to you at one point already but a review of my follow up folders says other wise.  And some of you may have already found them via a link in a blog post about system diagrams. 

But to make it easier for you to find them if you want them, I have included the slides in the zip file to the left along with white paper I wrote at one point that discusses primary secondary chilled water plant operation, including low delta-t syndrome.
Picture
session_1.zip
File Size: 69693 kb
File Type: zip
Download File

session_2_models.zip
File Size: 181440 kb
File Type: zip
Download File

Control Systems Lab Rotation Materials

I will have the materials you need for your lab rotation with me on a USB drive in the class room.  But, if you want to get them ahead of time, they are in the zip files to the left and below.   I will also put the follow-up materials here after everyone has taken the lab session, including the findings list for the condenser water system model you will be exploring in the lab session.
session_2_other.zip
File Size: 62669 kb
File Type: zip
Download File

SketchUp Model Exercise 7

Picture
2019-06-03_-_calculations.zip
File Size: 49479 kb
File Type: zip
Download File

Calculation Examples

The zip file to the left contains the calculation examples I shared this morning along with the slides from the presentation.  Hopefully, I did not throw you off too much by delaying the exercise with the cooling tower model.   But the good news there is that Barry and I talked about it after the session and I am going to work that exercise into the lab sessions that you spend with me next week.  So you will get a chance to try out your skills and discuss the results by scoping out a condenser water system in addition to being exposed to control system topics and doing some loop tuning and calibration work while you are with me.

Calculation Discussion Video

calculation_discussion_with_candace.zip
File Size: 114459 kb
File Type: zip
Download File

On Friday, I did a GoToMeeting with Candace to answer a few questions she had about doing an hour by hour energy calculation.  
 We recorded the meeting and since some of you may be doing a similar calculation, I asked her if she minded if I shared the video with everyone.  She generously said that would be fine.  So, the file above has the video in it along with the spreadsheet we were working on.

Candace is looking at replacing an electric resistance coil with a hot water coil in her corridor make-up air system.   That should generate savings on a number of fronts.  
​

Demand Savings

For one thing, her demand charges in the winter will go down.  This is particularly significant in her case because her utility uses a ratcheted demand structure.  That means that you pay for the peak that is set for the next year, even if all of the subsequent months have peak demands that are lower.   

​The electric preheat coil in her make up air system sets the peak demand for her facility for the year, higher than her peak in the summer when the chilled water plant is running.  By eliminating the winter time peak, the summer time peak will likely predominate.  But it is significantly less than her winter peak, thus significant savings will be generated.

Note that there will in potentially be some added electrical demand associated with serving the make up air unit preheat load with her hot water system because the hot water pumps will need to provide flow that that they currently are not providing.  This will likely be a new peak for the hot water system because it is likely that there currently is not a condition that generates a hot water demand condition as high as will be generated by serving the preheat load on a cold day.

The new peak hot water load is something that needed to be considered when making this change.  In other words, her boiler plant needed to have the capacity to handle this new, very significant load that will be imposed on it.   For a plant that was marginal prior to converting from electric resistance heat to hot water heat, that may mean you would need to add a boiler to be able to address the load. 

For Candace's facility, the designer determined that she had adequate reserve capacity available.  So, while her boilers will run for more hours than they currently run once the new coil is connected to the system, they will still be able to meet the load on a design day. 

This also means there will potentially be a slight increase in electrical demand associated with the boiler burners if the new load means that one additional boiler will fire that fired previously under peak load.  For instance, if her plant had three boilers and previously, it was only necessary to run two of them for the worst case condition and new, she will need to bring a third boiler on for the peak load, then there will be a slight increase in electrical demand associated with the third boiler firing. 

But, if previously, all three boilers had fired on the peak day, but at reduced capacity and the new load will also cause all three boilers to fire at a higher capacity, then, while more gas will be consumed, the electrical demand associated with the burners will not have changed. 

Energy Savings

Her energy cost will go down even though she will be delivering the same number of Btus as warm air.  As a general rule of thumb, assuming the utility generating mix is predominately fossil fuel fired, producing a Btu of heat with electric resistance heat will cost about two to three times what it will cost if you burn the fuel on your site in a relatively efficient boiler. 

That is because the heat rate for current technology fossil fuel fired power plants is in the range of 10,000 Btus of energy into the process in the form of a fossil fuel (gas or coal for instance) for every 3.413 Btus of energy out in the form of electricity.  In other words, the average energy conversion process associated with fossil fired power plants is currently about 34% efficient, even when the impact of combined cycle plants are taken into account.  On top of that, there are 6-8% losses in the grid between the plant and the meter on the site. 

You may recall all of this from the example I showed in the kick-off webinar.  I also wrote a blog post on site vs. source energy that discusses this if you want additional resources on the topic.

Carbon Reduction

Because the hot water based heating process will result in a reduction in the amount of electricity that needs to be generated, there will be a reduction in the carbon footprint associated with he operation of the make-up air unit. Even though burning fuel on the site to provide the heat will actually increase the site's carbon foot print, from a source energy standpoint, there will likely be a net reduction in carbon placed in the atmosphere due to the relatively low conversion efficiency associated with a fossil fuel fired power plant.  

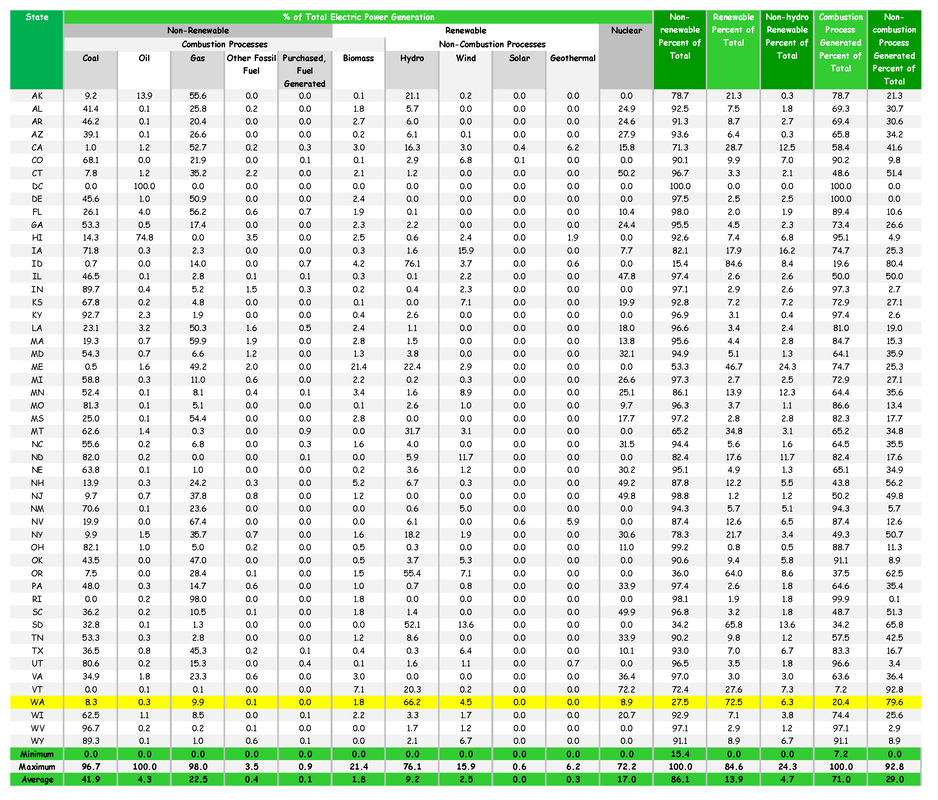
How much of a reduction is a function of the generating mix is for the utility;  i.e how much of its power comes from fossil fuels vs. wind power or hydro power or photo-voltaic power.   I am not up to speed on the utility where Candace's facility is located, but based on the most recent version of e-GRID that I have looked at, here in the United States, on average, about 71% of the power is generated by burning something.  

But, for instance, in Utah, over 96% of the power is generated by some sort of combustion process, primarily a coal fired process.  In contrast, in Oregon a little less than 63% of the power is generated by a combustion process while about 55% of it is generated by hydro power.   All of this is illustrated in the table below.
Picture
Societal benefits aside, the reduction in carbon foot print is important in the context of the AEP program since reducing carbon footprint is one of Marriott's corporate goals.  So this sort of impact is worth highlighting in your presentations when you make them.

Other Energy Benefits

Currently, Candace has focused her personal project on simply comparing the benefits of the new hot water preheat coil with the existing electric reheat coil.  But the new unit that is being provided includes an energy recovery wheel.  That means that there will actually be additional savings because the hot water coil will not have to produce all of the preheat, only the preheat that is needed to supplement the energy recovered by from the exhaust air flow.

Time permitting, this benefit could also be calculated using techniques that are similar to what we discuss in the GoToMeeting session.   That means that the savings numbers Candace comes up with by focusing just on the hot water vs. electric heat coil benefit will be conservative relative to what will be achieved.  With everything else that is going on in the world of a DOE or Chief or Assistant Chief or Engineering Technician, focusing on a basic, problem that provides a conservative estimate of savings is certainly a legitimate way to go in terms of "checking the box" associated with the learning opportunity.  You can "cover the base" associated with the additional savings and benefits by acknowledging them in your discussion and even offering to do the math if, for instance, your GM is intrigued and wants to know more.

Other Considerations

When you do a project like this, it is important to consider all of the possibilities.  By that, I mean that there could be other things, both good and bad that could happen as the result of the change you are making.   For the replacement of the electric resistance coil with a hot water coil, it is possible that there could be an improvement in guest satisfaction if the leaving air temperature control provided by modulating a hot water valve was more stable that the steps associated with a staged electric resistance coil.   
But that could go the other way if the control loop for the hot water valve was not properly implemented and tuned and the control process started to hunt.  In fact, if the control system and physical design of the hot water based preheat coil did not consider the fact that water can freeze, you could have a nightmare on your hands when it gets below freezing compared to what you had to deal with when operating an electric resistance coil when the outdoor temperature is below freezing.  Candace verified that this had been considered and discovered that the designer was putting a heat exchanger between the hot water system and the preheat coil, meaning that the preheat coil is actually being served by glycol, not water, and thus is immune to freezing.   

But the heat exchanger and its associated pumping circuit adds some complexity and parasitic energy consumption to the process, especially if the circulating pumps are redundant pumps.   If the circulating pumps are not redundant, then that means you have a higher risk of freezing something down stream of the coil or other issues if a pump failed on an extreme day.

Bottom line is that most energy conservation efforts will tend to increase the complexity of the system they are applied too.  As a result, it is important to recognize that and include all the necessary design features and sensors necessary to allow you to monitor and maintain the new improvement, including the training necessary to get your team up to speed and comfortable with it.  Otherwise the benefit will not persist and the money and resources will have been wasted.

SketchUp Model Exercise 6

Picture

Developing a Flow Profile for the Chilled Water Distribution System from Logger Data

For this session, we are asking you to use the "trick" I showed you for generating a flow profile for a variable flow primary/secondary plant that does not have a flow meter in the distribution loop by using pump test results, logged temperature data for the chillers, and logged amperage data for the evaporator pumps along with the principle of conservation of mass and energy.   

You will also get to try your hand at projecting the cost savings for modifying the control process to use a remote sensor (basically, applying the two thirds rule) and developing and assessing scatter plots of plant tonnage and flow relative to outdoor air temperature.
affinity_laws_speed_-_case_1_details_-_answer_v2.pptx
File Size: 2498 kb
File Type: pptx
Download File

The first file to the left is the PowerPoint presentation I used in the webinar.
exercise_instructions_-_dp_optimization_v1.pdf
File Size: 463 kb
File Type: pdf
Download File

exercise_materials.zip
File Size: 991 kb
File Type: zip
Download File

The pdf file to the left contains the instructions for doing the exercise.  The zip file contains the files you will need, which are described in the exercise instructions.
preheat_energy_savings_v5.xlsx
File Size: 6855 kb
File Type: xlsx
Download File

In the exercise development, I mention some of the results from the previous exercise.  Since I am still working on a written answer sheet and comments on the answers you sent in, i am providing the spreadsheet I used to for the calculations in the file to the left for those who are interested.   
2019-05-10_logger_data_files_v3.xlsx
File Size: 6630 kb
File Type: xlsx
Download File

exercise_data_-_flow_profile_v11_basis.xlsx
File Size: 38952 kb
File Type: xlsx
Download File

optimization_example.zip
File Size: 10292 kb
File Type: zip
Download File

The files to the left are the follow-up information from the webinar on Monday, May 20,2019.   The first file is the "answer" in the form of the workbook I showed to illustrate how I put the data together and built the flow profile and load profile as if I was doing the exercise.

The second file is a larger workbook which is the workbook I used to generate the logger data I gave to you.  I am providing it because it has more graphs in it and I was using some of those graphs to illustrate things like how the temperature decays with time after a machine shuts down. 

It is also the spreadsheet that has the comparison of the performance of the plant in the model with a plant serving "perfect AHUs"; i.e. when I showed the green cloud plotted on top of the data cloud for the plant in the model that you generated in the exercise.

The third file contains the spreadsheets showing how I took the flow profile for the plant and used it to compare the cost/benefit of adding a differential pressure sensor at a remote location to optimize the pumps instead of just controlling them for a fixed differential pressure at the plant header.  It includes a "READ ME" file that explains the other files.   

​This is part of what we will discuss in our next phone call.  But some of you are working on personal projects that will require you do something like this, so I wanted to post it now so you could look at it, and/or reverse engineer it or get in touch with me to discuss the technique sooner rather than later.

SketchUp Model Exercise 5

Picture

Assessing Air Handling Optimization Options

For this session, we are asking you to put some numbers to the observations you made during the Ball Room AHU Scoping exercise.  So you will need to work with that model supplemented by the information included in the zip file below.
Note that there are two packages in the zip file.   The idea is that you would start with the information in Package 1, which includes the instructions for the exercise.   By only using the materials in package 1, the model, and other resources that we have shared in the class so far, you should be able to develop the answers for the first seven questions.   This simulates doing basic assessments of the amount of energy being wasted at the current moment using field clues and some basic information.

Once you complete the questions associated with the first package, you can open the second package and proceed with performing calculations that will have a higher level of complexity because you will have to deal with load profiles and variable operating conditions.

ball_room_ahu_assessment_materials.zip
File Size: 1386 kb
File Type: zip
Download File

SketchUp Model Exercise 4

Picture
call_calculations_v1.xlsx
File Size: 5471 kb
File Type: xlsx
Download File

Assessing Pump Optimization Options

For this session, we are asking you to revisit the pump optimization calculations you did applying the techniques that were illustrated in the webinar where I demonstrated how to assess the savings associated with placing the Hand-Off-Auto selector switch for the lead evaporator pump back into the "Auto" position.  The spreadsheet file to the left is the file I created during the call.  
 I also inserted my actual calculations for all four climate zones into it so you can reference them if you want to.  And I believe Irma recorded the session and will be making that video available for you also.

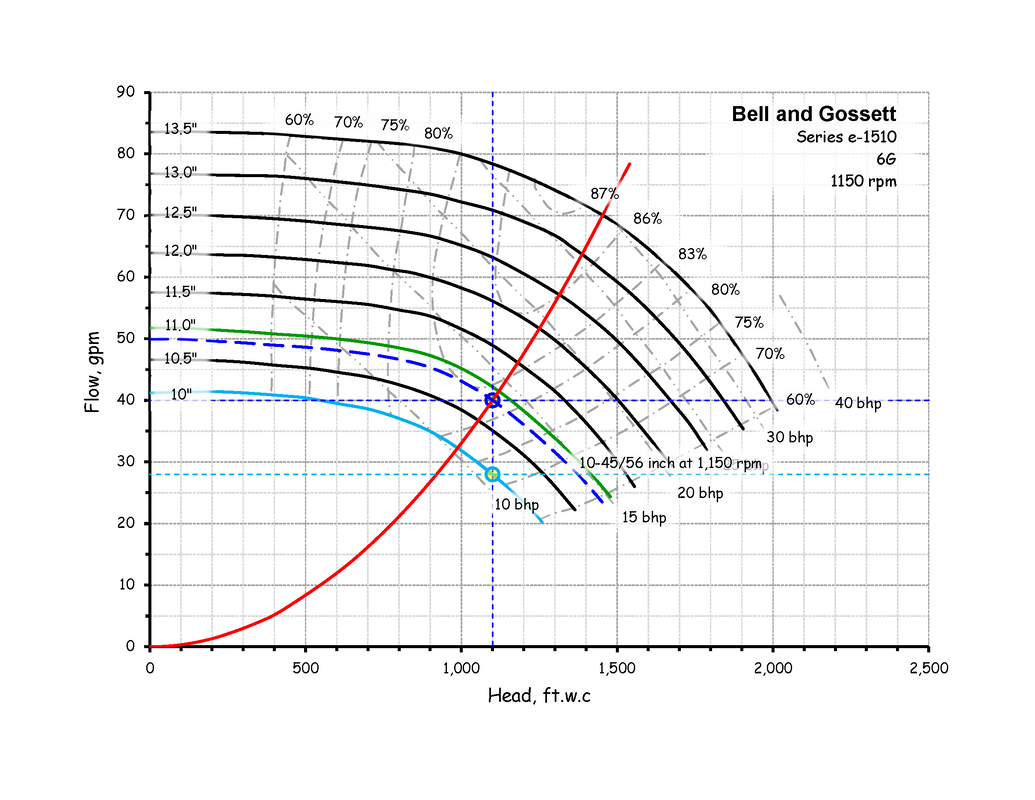
If you want to use Plot Digitizer to make an electronic pump curve, you will find that link on the Plot Digitizer page of the website.  In addition, you will find a spreadsheet that is all set up for you to use to generate a pump curve once you have digitized the data  on the Plot Digitizer Pump Curve Example page along with an informal video showing how to go about using Plot Digitizer and load the data into a spreadsheet to make the curve.

If the discussion about slip and how induction motors work got you curious and you want to know more, you will find a set of narrated PowerPoint slides on the Induction Motor Principles page of the web site that walk through those concepts.   There are a couple of videos where I do some simple experiments to demonstrate induction on the Induction Principles page.   And if you want to see a pump test happen along with observing how the slip and power draw of a motor changes as you throttle the discharge valve, you will find a video of that on the Testing a Pump page of the web site.

SketchUp Model Exercise 3

Picture

Developing Findings from the Chilled Water Plant

The document below contains the instructions and supporting you need to develop two selected findings in the chilled water plant;  the selector switch that is in "Hand" and the evaporator pump that is throttled.  We will discuss the exercise in the webinar on Monday, April 8, 2019.  So, we are asking that you work with your team to answer the questions and perform the calculations as indicated in the document.  Please send your answers to Barry with a copy to myself no later than close of business Friday , March 5, 2019 if at all possible.  
hyjend_hotel_chw_findings_development_v1.pdf
File Size: 97 kb
File Type: pdf
Download File

Note that you will also need the information provided below for SketchUp Model Exercise 1, including the answer key.
 

SketchUp Model Exercise 2

Picture
model_deployment.zip
File Size: 12735 kb
File Type: zip
Download File

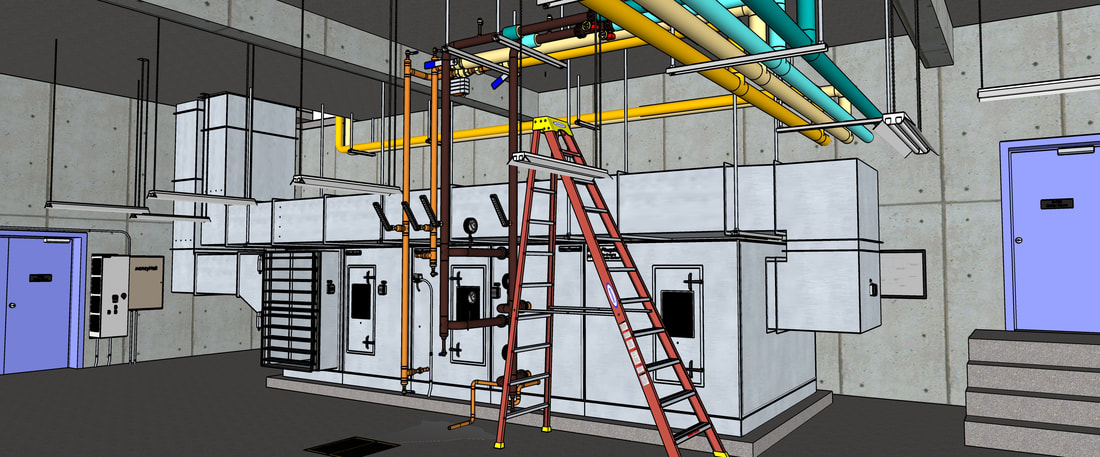
Scoping a Ball Room AHU

The files in the zip folder to the left are the files you need to work on the scoping a ball room air handling unit exercise.  We will discuss the exercise in the webinar on Monday, March 25, 2019.  So, we are asking that you work with your team to answer the questions included in the building description file and send your answers to Barry with a copy to myself no later than close of bussiness Friday , March 22, 2019 if at all possible.  
The zip file contains the following items.
  • ​Hyjend Hotel Ball Room System v1.pdf;  this is the information that sets up the exercise and includes the questions we would like you to address.
  • Ballroom AHU v19 SUv8.skp;  this is the actual SketchUp model.  I have tested it by opening it in a copy of SketchUp version 8.  So I think we are good to go with it.  
  • Scene Guide Ballroom AHU v1.pdf;  this is simply a little cheat sheet to help you use the numbered scene tabs.

Face to Face Meeting 1 and SketchUp Model Exercise 1

Picture
model_deployment.zip
File Size: 67287 kb
File Type: zip
Download File

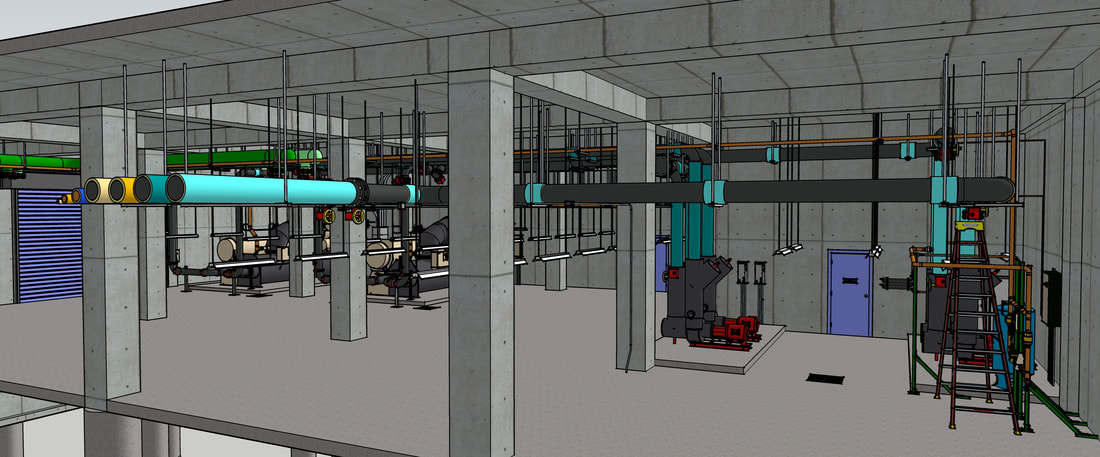
Scoping a Chilled Water Plant

The files in the zip folder to the left are the files you need to work on the scoping a chilled water plant exercise.  We will discuss the exercise in the webinar on Monday, March 11, 2019.  So, we are asking that you work with your team to answer the questions included in the building description file and send your answers to Barry with a copy to myself no later than Friday morning, March 8, 2019 if at all possible.  
The zip file contains the following items.
  • AEP 2019 First F2F final align.pptx, which are the slides Barry shared Friday morning before we started our lab rotations.
  • ​Hyjend Hotel Building Description v1.pdf;  this is the file that provides an overview of the facility that is served by the central plant and sets up the exercise (along with several that will follow).  It includes a list of 10 leading questions that are intended to guide you through the exercise.  These are the questions we will discuss in the webinar, and these are the questions Barry and I are asking you to be prepared to answer at that time.  Ideally, we would like to get a copy of your answers prior to the webinar, as indicated above.  
  • Plant V34 SUv8.skp;  this is the actual SketchUp model.  I have tested it by opening it in a copy of SketchUp version 8 and I noticed some of you moving around in it on Friday morning.  So I think we are good to go with it.  
  • Scene Guide Chiller Plant v34.pdf;  this is simply a little cheat sheet to help you use the numbered scene tabs.

Answer Key

The zip file to the right contains and answer key for this exercise, including my comments on the answers submitted by the various teams and the findings list for the issues that are built into the model.
2019-03-01_chw_plant_model_answer_key.zip
File Size: 76773 kb
File Type: zip
Download File

Monday, February 4, 2019 Webinar #7

Picture
2019-02-04_centrifugal_machines.zip
File Size: 48836 kb
File Type: zip
Download File

Centrifugal Machines

The zip file to the left contains the slides from the 7tj webinar, which focused on centrifugal machines. Centrifugal machines are the work horses of our HVAC systems;  all of the fans we use are centrifugal or axial flow fans;  99% of the pumps are centrifugal too with the most common exception being oil pumps for generators and boilers and chemical feed pumps, which are sometimes positive displacement.   
Chillers come in a variety of "flavors" but a common one is "centrifugal".  So, bottom line, understanding how centrifugal machines work can be very beneficial if you are working in our industry.

The zip file contains the following items.
  • The Skills worksheet with additional boxes checked off from this class session to give you a sense of where you should be in terms of the self study effort.
  • An "enhanced" version of the slides I presented this morning.   I added a number of slides based on the question that was asked along with slides that add detail on some of the things that came up in my mind as I presented.  Specifically:
  1. There is a slide that shows the relationship between psi and ft.w.c. (slide 8;  the tall, 1 inch on a side glass tube that you fill with water concept that I described).
  2. More detail on Net Positive Suction head, including the resource I alluded to and example of using the resource (slides 15-20).
  3. Improved animation and detail about how reducing pump speed tends to preserve or even slightly improve pump efficiency. (slides 21-26).
  4. Slides about how adding glycol impacts the pump curve (in response to a question I was just asked;  slides 27-28)
  5. Slides about doing a pump test (slides 32 - 54; in support of the question about how you come up with total dynamics pump head)
  • An example of a pump head calculation and pressure gradient diagram for a condenser water system along with the associated system diagram
  • An example of a fan static pressure loss calculation along withe the associated system diagram. 
Note that the system diagram associate with the fan static pressure calculation is for a high rise and is one of the most complex air system diagrams I have ever done so you may find it interesting in that context.   It was worth the effort because it allowed me to diagnose a number of issues that were mysteries up until then.  To give you a sense of that, I have included a copy of the section of the report I wrote  that discusses the issues using the system diagram to illustrate them.

During the class, I also mentioned a number of other resources that you might want to reference.
  • There are a number of blog posts about how you derive the unit conversion constant for some of the basic HVAC equations we use.  
  • The altitude correction factor spreadsheet I mentioned is under the Tools page of this web site.
  • There is a video demonstrating how to perform a pump test, including documenting how the various parameters like pump kW and differential pressure change over the course of the test on the Videos page of this web site.
  • A while back, I did a blog post on air entrainment and cavitation in condenser water systems that has a section specifically about cavitation that will supplement the discussion in the presentation this morning and the enhanced slide set included with the zip file.
  • The same blog post I mention in the previous bullet also has a section about Net Positive Suction Head that will supplement the discussion this morning and the other resources I mentioned on the topic.

Monday, January 28, 2019 Webinar #6

Picture
2019-01-28_-_loads_and_psychrometrics.zip
File Size: 75172 kb
File Type: zip
Download File

Loads and Psychrometrics

The zip file to the left contains the slides from the sixth webinar, which focused on loads and psychrometrics. At the end of the day our systems need to closely follow the load profile if they are to perform at peak efficiency.  As you hopefully gleaned from the webinar, the load profile can be quite dynamic and will vary from hour to hour and season to season.   
For most Building System applications, virtually all of the end use loads are served by supplying conditioned air, this it is important to understand how air, in particular, moist air behaves.  This is what the science of psychometry is all about.  That is why knowing how to use a psych chart is such an important skill for those of us who work with building systems.

The folder also contains a number of other files that I worked with during the presentation including:
  • A folder with a paper about the Cooling Load Temperature Differential method of load calculation along with the tables you need to do the calculation.
  • A paper that compares three common software programs that are used to model buildings and develop the load profile for design purposes.
  • The spreadsheet with the load profile that Sabastian and I created for the Atlanta Airport Marriott's chilled water system.  It is an example of the building telling us what the load profile looked like, which is a lot more accurate than any calculation or model you can do since it contains no assumptions, just reality.  Of course, the reality might include load elements that should not be there, like the dysfunctional economizers we have identified at the Atlanta Airport Marriott.  As a result, the building also pointed us at some opportunities to improve things.
  • The psych chart we developed during the webinar. You may want to begin your exploration of the psych chart tool by opening it up and adding some more constant lines to it, looking up the design conditions for your location, and doing a bin plot of the climate for your location.
  • The skills table with boxes checked to illustrate about where you should be in your self study effort.
During the webinar, I also pointed you at a number of resources including:
  • A blog post that walks you through the basic operations you can do with your electronic psych chart tool, along with highlighting the benefits of the professional version that you have.  Note that the chart in the post is the Pacific Gas and Electric company version of the hands down software tool.  But it literally is the same software as your chart with a different color theme and logo applied to it, so the steps I discuss in the blog post will work with your version of the tool.  Also note that the free version of the PG&E chart is much more limited than your version is.  You have what amounts to the professional version of the chart, which is what I highlight at the end of the post.
  • A number of additional blog posts on psychrometrics and the psych chart, including several posts that show you how to go about building your own chart using basic psychrometric relationships and Excel.
  • The Honeywell Gray Manual, which has a good, basic chapter on psychrometrics.  One way to learn how to use your new tool would be to work through that chapter and do the exercises in your tool instead of on a paper chart.
  • The RCx University web site, which supports a program for the Construction Engineering Research Laboratory (CERL) that is very similar to the AEP program.  The site is organized around the same 10 skills that we use to organize the AEP program and the HVAC Fundamentals page includes a number of psych chart topics.
Finally, I meant to highlight one additional resource during the presentation but forgot to do it.  You  may have already found this via the Resource List and EBCx Guidebook.  But if not, you will want to check out KW Engineering's Get Psyched Excel plug-in. 

​Once you have the plug in installed, you will discover that Excel now has functions that you can use to calculate psychrometric properties from a dry bulb temperature and any indicator of humidity, including dew point, relative humidity, wet bulb temperature and humidity ratio.   That means if you log the temperature and humidity change across a cooling coil, you can use those two logged pieces of data to calculate enthalpy entering and leaving the coil and then use the enthalpy difference to calculate the load on the coil;  pretty handy!

Tuesday, January 22, 2019 Webinar #5

Picture
2019-01-22_-_data_logging_and_trending.zip
File Size: 194227 kb
File Type: zip
Download File

Data Logging and Trending

The zip file to the left contains the slides from the fifth webinar, which focused on data logging and trending. The data you collect from your loggers and control system will be one of the ways you start to have a dialog with your facility.  The folder also contains a copy of the Skills table with boxes checked to show about where you should be in your self study effort along with the two SketchUp models I used in the webinar in case you want to play with them and practice your SketchUp navigation skills while waiting for the "Easter Egg Hunt" model.  There is also a copy of the data logger file from my little test to see how fast the domestic hot water temperature came up in my hotel room if you want to look at that.
During the webinar, I pointed you at a  number of resources including the following.
  • The Onset web site is full of resources to help you understand how to work with their logger including webinars, self guided training, and how-to videos.
  • The Data Logging page of this web site has links to a number of resources
  • One of the resources on the Data Logging Page that you might find to be particularly useful is a video that Bill Pottinger made that shows you how to deploy your motor logger. Bill was the lead at the Pacific Energy Center's tool lending library until he retired earlier this year and does a great job of it.  While the video is specific to the motor status logger, the techniques you use to interface to it to launch and retrieve data are very similar to the way Hoboware works with all of the Onset loggers.
  • If your facility happens to be in the California Public Utility Service Area, you can use the resources in the Pacific Energy Center tool lending library.  In addition to loggers, the library literally has thousands of other tools that are ideal for people doing building science and commissioning work.
  • You will find a copy of the Monitoring Plan I showed during the webinar along with a blank version of it on the Monitoring Plan page of this web site.

Monday, January 14, 2019 Webinar #4

Picture
2019-01-14_-_system_diagram_and_system_concept.zip
File Size: 26334 kb
File Type: zip
Download File

System Diagrams and the System Concept

The zip file to the left contains the slides from the fourth webinar, which focused on system diagrams and the system concept. These concepts are important commissioning tools and the system diagram itself will serve as a framework for developing your monitoring plan and figuring out what you need to do to test the system you have targeted for your personal project.  The folder also contains a copy of the Skills table with boxes checked to show about where you should be in your self study effort.
During the webinar, I pointed you at a  number of resources including the following.
  • There are a string of blog posts that are essentially a text book on how to develop system diagrams.  This link will take you to a page that has all of them linked from it.
  • The system diagram symbols page of this web site has a PowerPoint tool that contains common system diagram symbols for air handling and pumping systems along with an example of an air system diagram and a water system diagram that were created in PowerPoint.  For those with access to AutoCAD or software that will open .dwg or .dxf files, there is a zip file with all of my AutoCAD system diagram symbols in it along with air and water system diagram examples in the form of AutoCAD files.

Monday, January 7, 2019 Webinar #3

Picture
Webinar 3 (2019-01-07_scoping_and_obvious_indicators.zip)
File Size: 31283 kb
File Type: zip
Download File

Scoping and Obvious Indicators

The zip file to the left contains the slides from the third webinar, which focused on scoping and obvious indicators.  In other words, it was about how to pick up on clues regarding opportunities to improve performance and save energy.   This will be an important skill for you to develop because it will help you firm up the estimated savings potential associated with applying your AEP skills to your facility for your February 4th GM report.
As you learned in the first webinar, you can project the savings range that might be achievable for your facility by applying industry metrics from the LBNL Cost and Benefit of Commissioning report to your annual utility costs.  This, of course, is a hypothetical number that is based on savings in other buildings but rooted in your actual consumption patterns.

The scoping skill allows you to firm up your savings projection by identifying real targets in your facility that, if addressed, will help you achieve the projected savings.   By applying a fundamental principle and doing a bit of math, you may even be able to come up with a firm savings range for a given observation.    I illustrated this in the webinar for a scheduling opportunity where, by:
  1. Observing the selector switch for a pump that was supposed to be scheduled was in "Hand", and
  2. Using the pump power equation and data from the pump nameplate and pump curve, and
  3. Estimating how many hours the pump was running when it should not have been running
we were able to fairly accurately estimate the savings that would be achieved if we addressed the problem.  

So, the idea is for you to do the same thing in your facility, creating a list of your observations as you go so that you can prioritize them and target one of them for your personal project.  In the commissioning industry, this is called a "Findings List" and I included an example from my first walk-through of the Columbus Renaissance, where we held the field part of the 2015-2016 AEP class in the zip file above.

Bottom line, your projected savings and your findings list along with a brief narrative or presentation explaining what the numbers mean is all you need to do to produce your report for your GM.   As Barry mentioned during the webinar, you could use Slide 14 from the presentation as a template for presenting your savings, and as I mentioned towards the end, you could adapt the Columbus Renaissance findings list as a way to document your targets; it really is just a table that itemizes the things you want to pursue to capture your projected savings and help you track your progress.

During the webinar, I also pointed you at a number of other resources to help you with your efforts including the following:
  • The EBCx Guide Book, which provides an overview of why the various EBCx skills matter and points you at resources for learning them.  The Resource List on this web site provides a good supplement for resources to learn more about the 10 Skills.
  • The EBCx Skills Checklist, which you can download from the same page as the Guide Book, is a way to track your progress and also has links to resources for each skill.
  • I mentioned using regressions and data clouds as a way to understand were opportunity might lie.  While this is an advanced skill and not something you absolutely need to focus on, if it tweaked your interest, I have done a number of blog posts that include videos that walk you through how to go about doing it.
  • The spreadsheet I used to assess what the mixed air temperature should be for a given outdoor condition, return air condition, and outdoor air percentage can be found on the Mixed Air Calculations page of this website.  If you want to understand the physics behind the relationships in the spreadsheet, then you may be interested in the blog post I wrote that derives them from the steady flow energy equation.
  • You will also find a number of blog posts that provide examples of scoping and related opportunities.  This link should give you a page full of them and they may give you some ideas to pursue in your facility.

Monday, December 17, 2018 Webinar #2

Picture
Webinar 2 (framing_up_v1.zip)
File Size: 37498 kb
File Type: zip
Download File

Framing Up Your Project

The zip file to the left contains the slides from the second webinar, which are focused on the bench marking and utility consumption analysis and how that information can be used to help establish budgets and expectations for your project. These are the basic steps you need to perform to develop the cost recovery report for your GM.

​Some folks had trouble downloading the webinar 1 file as a PowerPoint. So I thought I would try the zip file approach to see if that works better.  ​
With regard to specific resources to help you with the content of this particular webinar:
  • You can get to RCxU from the link I provide on the Home Page of the website.  (There is also a link to the Cloud Appreciation Society's website if you were intrigued by that.)
  • The spreadsheet behind the bench marking and utility analysis I did for the Atlanta Airport Marriott based on their 2013 utility data is included in the zip file above.
  • I actually wrote a blog post about the technique I discussed in the webinar an illustrated it with the Atlanta Airport Marriott data.   So if you want a refresher on what I presented along with a more in-depth discussion of the topic and techniques, you will find that blog post at this link.
  • The blog post about Site vs. Source Energy is at this link.
  • This link should open up a page on the blog site that has a listing of all of the blog posts I have done about doing scatter plots and regressions.  Technically, that is further along than you need to go right now.  But if my illustrating the technique  caught your interest, I think you will find some useful in these posts, including videos demonstrating the Excel techniques associated with the process.
  • A blank copy of the Utility Consumption Analysis spreadsheet tool (UCAT) that I highlighted in the presentation (slide 56) is included in the zip file.  The paper I wrote for ICEBO is located on the Resources page of this website under Materials from Classes and Presentations - ICEBO. 

Thursday, December 6, 2018 - Kick-off Session

Picture
Introduction to Cx (introduction_to_cx_v3.pptx)
File Size: 76061 kb
File Type: pptx
Download File

Introduction to Commissioning

The PowerPoint file to the left has the slides from the Kick-off session, which are focused on the basics of the commissioning process.  Also, to help you get started using the site:
  • This link will take you to the page that has the EBCx Skills Guidebook and the spreadsheet tool for tracking your progress.
  • This link Resource List will take you to the page with the Resource list.
  • This link will take you to the page with Bill Coad's Energy Conservation is an Ethic paper.
  • This link will take you to the paper I did about the dysfunctional AHU at the Komatsu clean room.

Home

Blog

Resources

Contact

Picture
A Field Perspective on Engineering - © 2017 Facility Dynamics Engineering, All Rights Reserved
(Contact Me to Check on Lefts or Any Other Questions You May Have about Permissions)