Pump Power and Energy
|
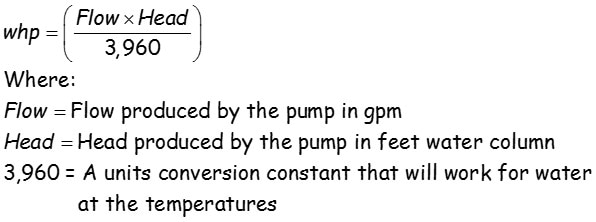
Pumps add energy to a fluid stream and create mass in motion. If you have ever run into a door or had something fall on your head, then you know that mass in motion represents power. So, it's fairly logical to realize that you can calculate the amount of power - termed water horsepower - produced by a pump from the flow rate and pressure the pump produces.
Incidentally, most people discuss the pressure produced by a pump in terms of head, measured in feet of water column instead of pounds per square inch.
Notice the 3,960 in the denominator of the equation. It's an example of a unit's conversion constant like the number 1.08 in the equation we discuss on the page with our Altitude Correction Factor spreadsheet. That constant makes the equation specific to water in the range of 40°F to 220°F, meaning the equation will be reasonably accurate for the ways we use it in our industry if you apply it to water that is with-in that temperature range.
It will be the most accurate with water at 65°F since that is the density used in developing the units conversion constant. If you are curious about that derivation, we walk you through it in our blog post titled Unit Conversion Constants; Why Consistent Engineering Units are Important and Where the 3,960 in the Pump Power Equation Comes From. Our point in bringing it up here is that if you were to use this equation for a pump that was pumping benzine or mercury, while the concept is correct, i.e. the power required is directly related to the flow and head produced, you would get the wrong answer using 3,960 because the densities of benzine and mercury are quite different from the density of water. You could of course develop a correct units conversion constant for those liquids and be good to go in terms of assessing the pump energy by this technique.
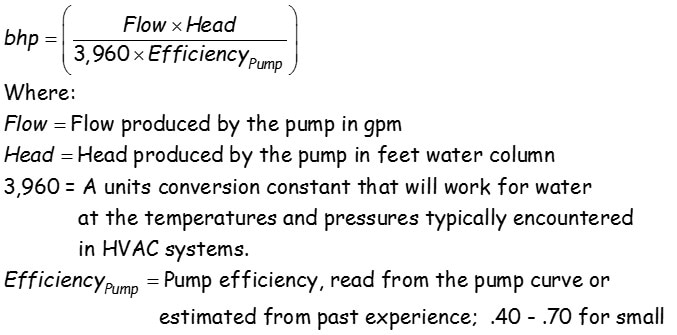
Water horsepower represents the energy that shows up as mass and motion in the piping circuit. But since pumps are not perfectly efficient, you need to divide that number by the pump efficiency to come up with the brake horsepower that is required to be put into the pump shaft to deliver the water horsepower represented the flow rate at a given head.
The notes provided with the equation give you some ideas regarding what to use for pump efficiency if you are out in the field with out access to a pump curve. But picking it up from the pump curve is likely to be the most accurate way. Frequently, you can also read the pump brake horsepower from the curve. Another trick is if you have the pump schedule and it shows the brake horsepower at the selection point, you can use this same equation to calculate the anticipated efficiency at the design operating point by solving it for efficiency.
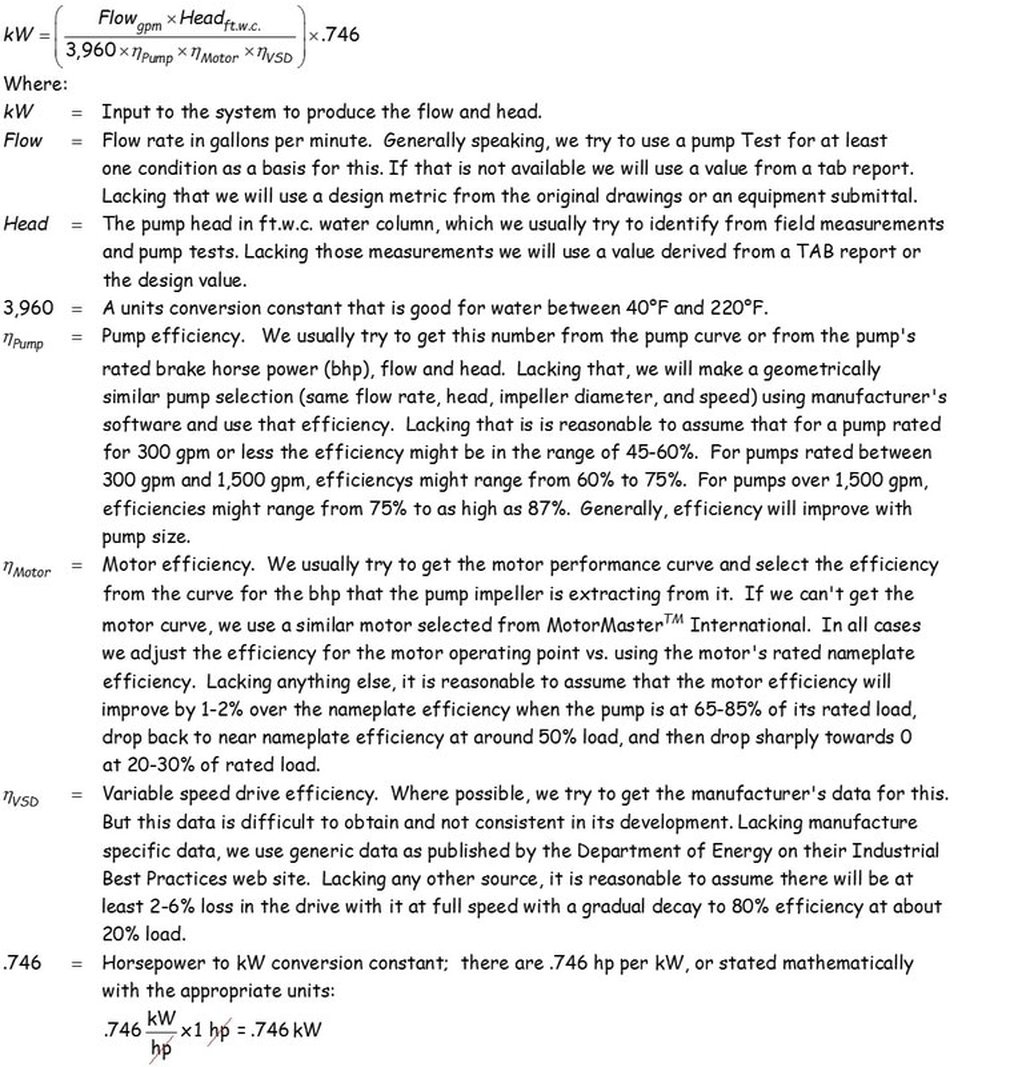
At this point, we have the power going into the pump shaft. But the stuff between the pump shaft and the utility meter also has losses. Typically, we take the losses in the motor and drive system into account, but there are actually more losses than that if you trace stuff back to the source. More on that in a minute. For now, if we want apply the losses for the motor and the drive system to the brake horse power equation to come up with the energy into the drive system in terms of kW, the formula above morphs to the following.
At this point, we have the power going into the pump shaft. But the stuff between the pump shaft and the utility meter also has losses. Typically, we take the losses in the motor and drive system into account, but there are actually more losses than that if you trace stuff back to the source. More on that in a minute. For now, if we want apply the losses for the motor and the drive system to the brake horse power equation to come up with the energy into the drive system in terms of kW, the formula above morphs to the following.
The notes in the .wmf version of the equation give you a pretty good sense of the options for evaluating the various parameters, so this is the version we provide for you to use as a starting point below so you can use them to document your math in a spreadsheet, report, or presentation. . If you want the other versions (bhp or whp) you can simply edit this version down to those versions in Microsoft Equation 3.0 or MathType.
| Pump Power (kw_into_a_pump_-_web.wmf) |
So far, we have been talking about power, which is:
- The rate at which energy is being used, or
- Energy consumption per unit time, or
- The instantaneous rate of energy use.
| Killowatt Hours (kwh_-_web.wmf) |
Note that for a fixed flow, steady state load, the kW level will typically be constant. But for a variable flow load, where all of the parameters behind the pump kW might vary over time, the calculation becomes more complicated.
In theory, to get the perfect answer, we would have to calculate the kW for every different condition that existed, multiply it by the number of hours that it existed, and then add all of those numbers together to obtain the energy consumed for the time period under consideration. For a load where the power consumption varied from minute to minute, we would have to do 525,600 calculations to get the power consumption over the course of a year (8,760 hours per year times 60 minutes per hour).
We generally simplify this by assuming some sort of average power consumption over some typical period of time or typical condition. Since the power consumed by many HVAC systems varies with the weather, if we have hourly weather data, we can assume an average power consumption for each hour and do the math that way. If you are wondering about how to come up with hourly weather data, there are a number of posts on our web site about how to do that. There is also a post about a free electronic psych chart tool you can download from the Pacific Energy Center that, when you upgrade it, will provide an hourly weather data file with all of the psychrometric conditions for a given climate included in it.
In any case, doing an hourly calculation is still 8,760 different conditions that you have to do calculations for. But since the equations are the same for each hour (its only the variables like flow, pressure motor efficiency, etc. that change) it is not too difficult to do in an electronic spreadsheet. And, the smaller the time interval is that you use, the more accurate your results will become (assuming good input data).
But before electronic spreadsheets (and even now, with electronic spreadsheets) we can further simplify the process by using bin weather data, which divides the climate into "bins" that contain the number of hours per year at a given climate condition.
One of the reasons this approach to estimating pump power and energy is handy is that the amount of power a pump uses will generally be less than the rated horsepower of the motor serving it. For more about why that is, you can take a look at a series of on-line slide presentations and videos that were produced by the Pacific Energy Center.
We also explore the topic in two of our blog posts.
- Motor Optimization; Same Efficiency + Different Slip = Different Savings looks at how motors with the same horsepower rating but different full load speeds will come into balance with a given centrifugal load at a slightly different operating point.
- More on Squirrel Cage Motors and Slip takes a general look at how induction motors work as a follow on to the previous post.


