Excel Time Value Conversion Spreadsheet
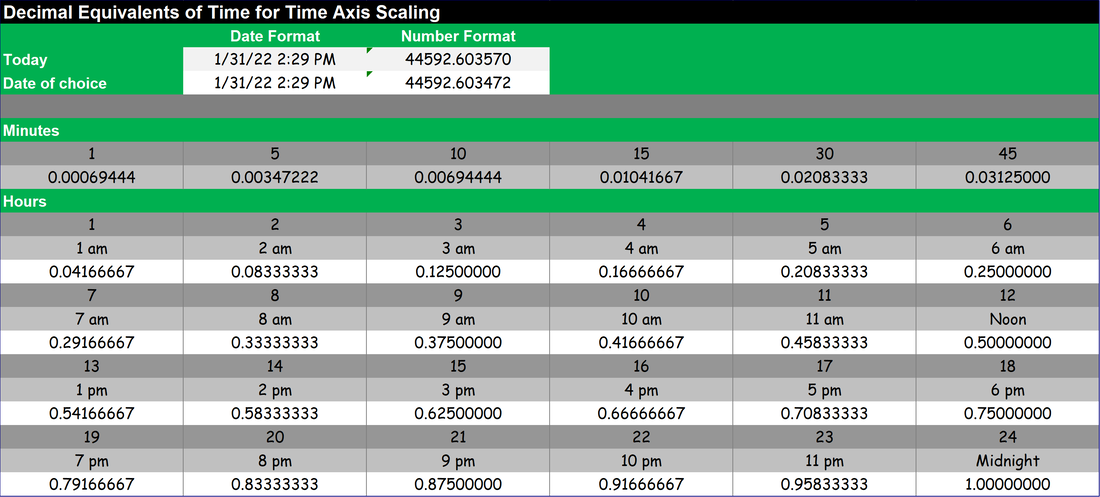
As many of us know, Excel represents dates as a serial number so that it can do math with them. For instance, if you looked at the value in a cell that had "1/31/22 2"29 PM" in it, you would actually see 44592.603472. It is the formatting of the cell that causes it to display as a number.
Personally, I did not always know this and for a while, when I first started using Excel, was baffled by how to format a time series axis for a specific date range and for specific major and minor divisions. As a result, I built a little spreadsheet that I uses as a "cheat sheet" when I am setting up time series graphs.
At some point, Excel took a bit of the mystery out of things because if you are formatting a time series axis and simply type the date and time you want for the "minimum" and "maximum" value fields (the fields with the red arrows pointing to them in the image below), then Excel fills in the appropriate value.
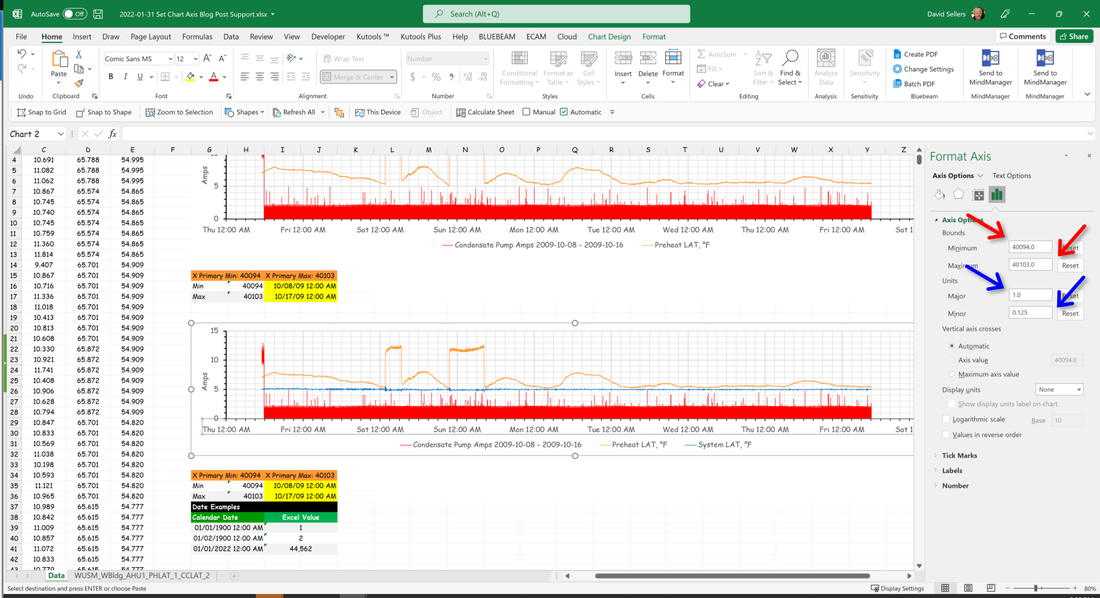
But I have yet to figure out how to do a similar thing for the "units" fields (the field with the blue arrows pointing to them in the image above), so I still rely on my little cheat sheet for that sort of thing, especially when I need a unit that is not common increment of 1 (like 0.00069444 for 1 minute which eludes my aging memory vs. .125 for 3 hours, which I can remember or derive pretty easily).
So, I figured others might find it useful as well and offer it here, for what it is worth. You may also find the blog post that I did on the topic to be helpful if this is all new to you.
So, I figured others might find it useful as well and offer it here, for what it is worth. You may also find the blog post that I did on the topic to be helpful if this is all new to you.
| time_value_conversions_vweb.xlsx |
On a related note, I discovered that it is possible to use a User Defined Function (UDF) to allow Excel to adjust the minimum and maximum axis values by referring to cells in a spreadsheet where you enter the values you want, which makes it possible to quickly and somewhat dynamically change the range of a chart with out having to go through the axis format dialog. I provide the details in a blog post titled Using a Formula to Adjust an Axis in Excel, Plus a Simultaneous Heating and Cooling Case Study. The spreadsheet I use to illustrate this is provided below in case you want to download it for reference.
| set_chart_axis_support_vweb.xlsx |