Plot Digitizer Example |
What follows is an example of a digitized pump curve I created using Plot Digitizer and a spreadsheet template that I developed that makes it pretty easy to take the CSV files you get from Plot Digitizer and load them into the spreadsheet so they show up in a chart with out a lot of effort to select series, format things, etc. I include a link to a copy of the spreadsheet at bottom of the page along with a video illustrating the basic steps for using plot digitizer to generate the raw CSV files you would need in order to use it. The template itself has instructions in the various tabs that tell you how to use it once you have the CSV data.
The purpose of the spreadsheet template is to allow you to take the very basic CSV data generated by plot digitizer for say, an impeller line, which looks like this ...
The purpose of the spreadsheet template is to allow you to take the very basic CSV data generated by plot digitizer for say, an impeller line, which looks like this ...
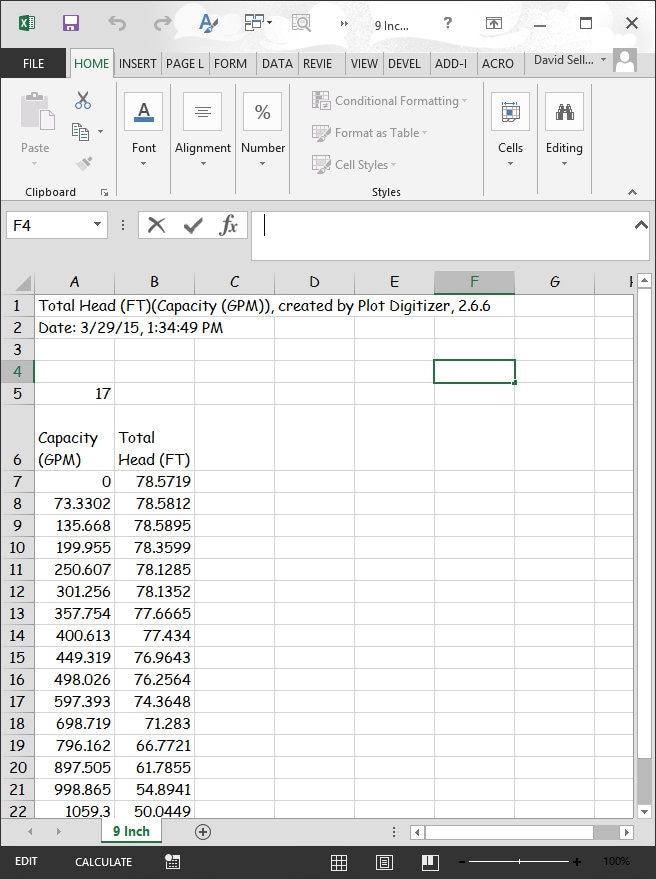
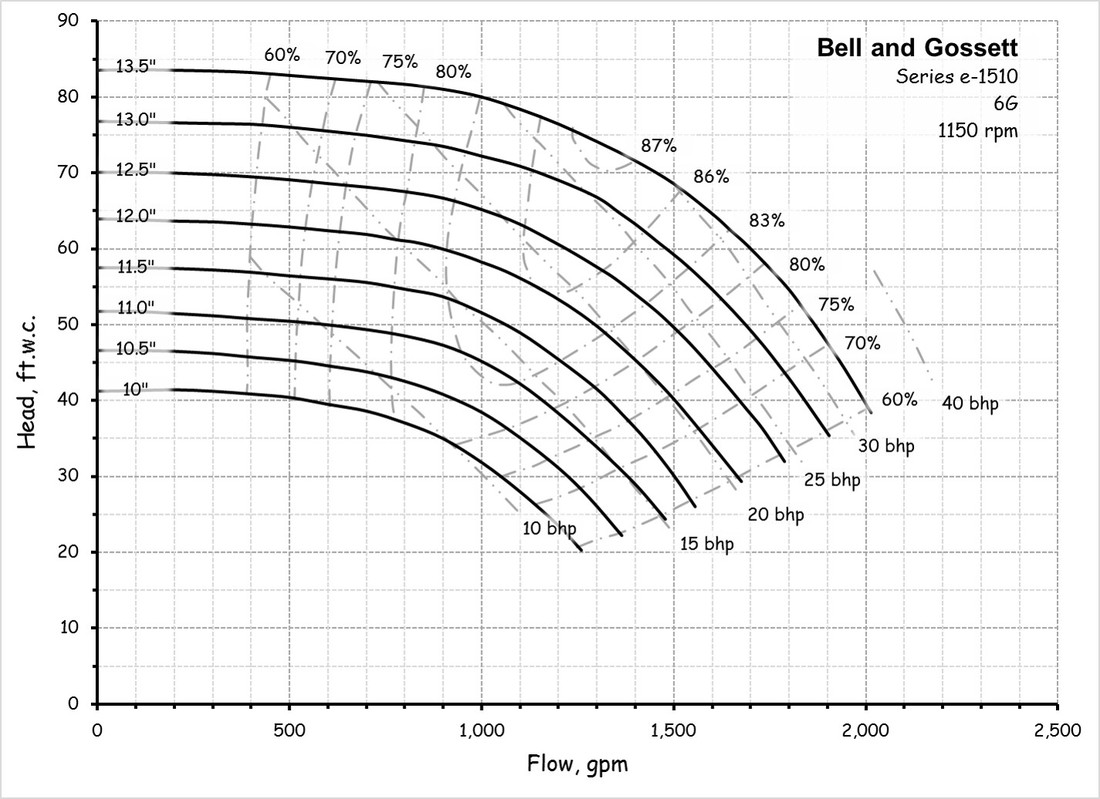
... and combine it with other, similar files for other lines on the chart to reproduce the pump curve as a chart/graph in an Excel spreadsheet.
The value in making that effort is that you can now easily plot other data that you may be of interest in the context of analyzing a pump directly on the chart using standard Excel charting techniques.
For example, perhaps you have run into a pump out in the field with a throttled valve on its discharge and you want to assess what your options are in terms of optimizing it to eliminate the wasted energy associated with pumping the design flow through a throttled discharge valve. A common way of performing this analysis is to plot various conditions on the pump curve and use the that information for energy and power calculations for each of the operating points you are exploring.
The typical starting point for such an analysis is to plot the design operating point and system curve on the pump curve. In the olden days, we would accomplish that by making a table on a piece of graph paper that had a column for flow and a column for head. The, we would use the "square law" to calculate a number of points on the system curve based on our design operating point using a slide rule or a calculator, fill in the table, and then manually plot the results on a paper copy of the chart.
Now-a-days, most of us would do the system curve math in an electronic spreadsheet, at least that is what I would do. The image to the left below is an example of that. But before I discovered Plot Digitizer, I still had to plot that data on a paper copy of the chart, or an image of it so I could perform the analysis. I while back now, I started using an image of the curve loaded into PowerPoint instead of literally drawing on paper for a number of reasons. The PowerPoint slide to the right below is an example of what that might look like (for a different pump from the one associated with the curve above).
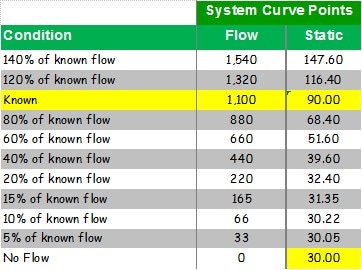
Spreadsheet Calculation Example: The known values are entered into the yellow cells and formulas in the other cells reference them and use the square law to calculate points on the system curve based on arbitrarily selected flow values.
|
|
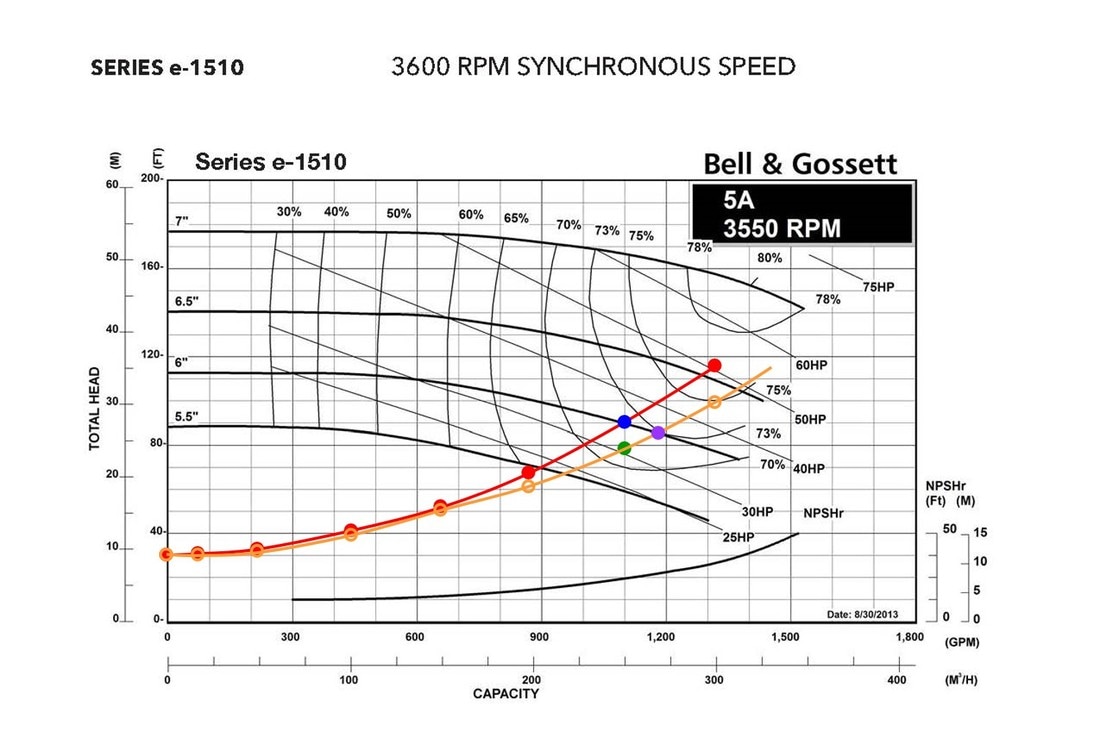
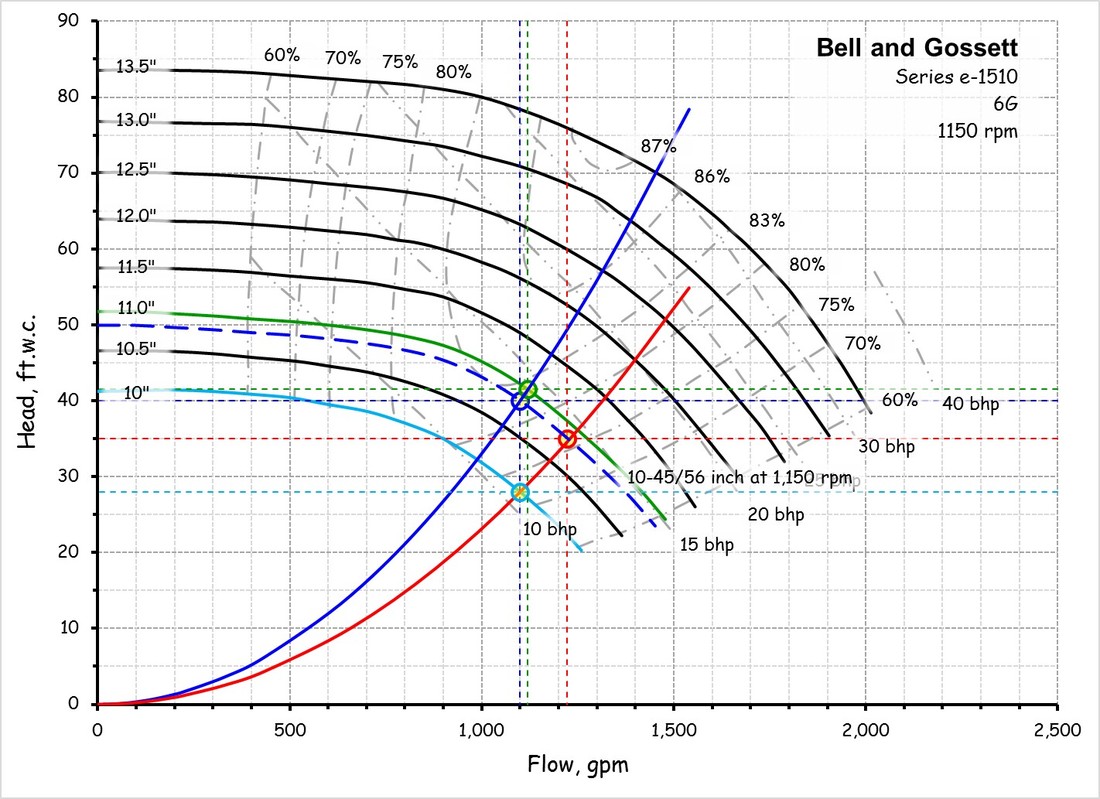
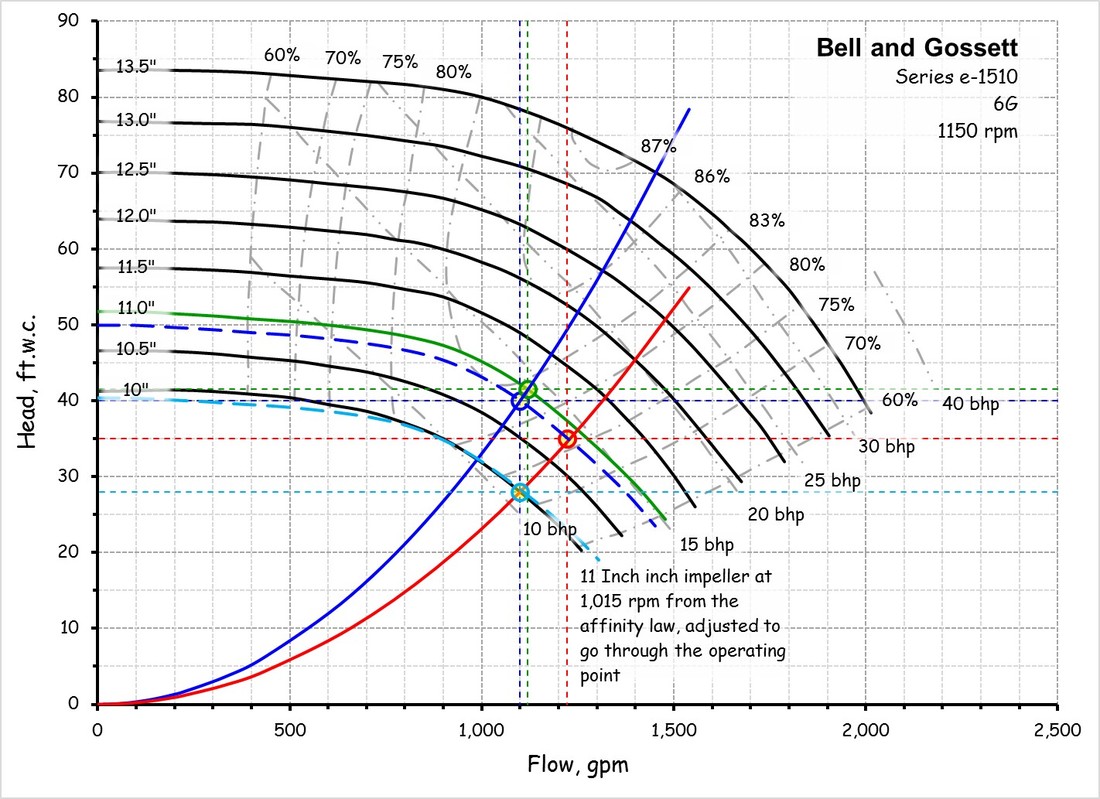
But if you have used Plot Digitizer to create a chart representing the pump curve in Excel, you can easily plot the system curve and other data that you may be of interest in the context of analyzing a pump directly on the chart using standard Excel charting techniques. In the images below, I used this approach to compare an impeller trim (left) to a speed change (right) for optimizing a pump that had a throttled valve on its discharge.
|
|
If you only needed to plot a design point and a system curve, the probably the old-fashioned way will be faster. But, on the other hand, once you have digitized a curve, you will have it to use for any project with that pump on it moving forward. So there can be an economy of scale in addition to a reduction in the time required to do a specific analysis if multiple calculations and plots will be required, as might be the case for the analysis of a variable flow pumping system or fan system.
The link that follows will take you to the template I use as the starting point for my Pump Digitizer Pump and Fan Curves.
The link that follows will take you to the template I use as the starting point for my Pump Digitizer Pump and Fan Curves.
| Digitized Pump Curve Example (pump_curve_starting_point_vweb.xlsx) |
The video below is a very informal screen capture I made to show one of our Office Admins how to perform the digitization process. That is a win for both of us because she appreciates the work and it saves me the time and allows me to focus on other stuff while she does the basic digitization effort. In fact, since the point in time where I made the video, she has learned to take the template I am providing here and get the raw data into the chart, saving me even more time.