A Field Perspective on Engineering Commissioning Resources
  • Home
    • What's New
  • Blog
    • Blog Support
  • SketchUp Models
    • SketchUp Resources
    • Bureaucratic Affairs Building HHW System Logic Exercise
    • Bureaucratic Affairs Building Scavenger Hunt
    • Chilled Water Plant System Diagram Exercise
    • The HIjend Hotel >
      • Chilled Water Plant Scoping Exercise
      • Ballroom AHU Scoping Exercise
      • Cooling Tower Scoping Exercise
  • Tools
    • Altitude Correction Factor
    • Economizer Evaluation Checklist
    • Eikon for Educators and WindLGC
    • Effective Duct Length Tool
    • Excel Third Axis Tool
    • Excel Time Value Conversion
    • Insulation Savings Tools
    • Logic Diagram Tool
    • Mixed Air Calculations
    • Monitoring Plan Spreadsheet
    • Pipe Friction Chart
    • Plot Digitizer >
      • Plot Digitizer Pump Curve Example
    • Square Law Spreadsheet
    • System Diagram Symbols
    • Thermodynamic Diagrams Spreadsheet
    • Universal Translator Data Analysis Tool
    • y = (m * x) + b Spreadsheet
  • Useful Formulas
    • Affinity Laws
    • Circular Equivalent Duct
    • Effective Duct Length
    • FT Guide Appendix C
    • HVAC Equations and Concepts
    • Hydraulic Diameter
    • Pump Power and Energy
    • "Square Law"
  • What's That Thing?
    • Cooling Towers
    • Pumps
    • Valves
  • Resources
    • Bill Coad's Writings
    • Data Logging Resources
    • EBCx Skills Guidebook
    • Energy Design Resources
    • Fisher Controls Valve Cavitation Bulletin
    • Functional Testing Guide
    • Honeywell Gray Manual
    • MCC Powers Bulletins
    • NBCIP Reports
    • PEC Tool Lending Library
    • PID Resources
    • Pneumatic Control Resources
    • Resource List
    • Scoping Resources
    • TAB Resources
    • Vintage Carrier Design Manual
    • VRF Systems
    • Williams' Wisdom
  • Videos
    • Bureaucratic Affairs HHW Logic Answers
    • Cooling Tower Flow Variation
    • Economizer Stratification
    • Functional Testing
    • Induction Principles
    • Monitoring Plans
    • Ripple Effects
    • Testing a Pump
    • The Garden of Low Entropy
    • Variable Flow Systems
  • Training
    • Materials from Classes and Presentations >
      • ACEEE
      • ASHRAE
      • ASHRAE - Engineers Notebook
      • BCxA and NCBC
      • BEST Institute
      • Case Studies
      • ERDC 2020 RCx Academy
      • ELPNW
      • ICEBO
      • Marriott AEP
      • Magazine Articles
      • NAVFAC
      • Pacific Energy Center Design, Performance and Commissioning Issues Classes >
        • PEC Class Materials Archive
      • Pacific Energy Center EBCx Project Review
      • Pacific Energy Center EBCx Workshop Series >
        • EBCx Workshop Series 12
        • EBCx Workshop Series 13
        • EBCx Workshop Series 14
        • EBCx Workshop Series 15 >
          • Student One On One Discussions
        • EBCx Workshop Series 16
        • EBCx Workshop Series 17
      • Portland General Electric
      • U of W >
        • U of W Archive
    • On Demand Training >
      • Benchmarking UCA and Scoping
      • Loads and Psychrometrics
      • Induction Motor Principles
      • Introduction to Functional Testing
      • Scope of Work Documents
      • System Diagraming
    • Training Opportunities
  • Contact
    • Copyright and Permissions

Plot Digitizer

To be perfectly clear, Plot Digitizer is not a tool I developed.  Nor can I claim to have discovered it;  it was shared with me by my friends at Carbon Lighthouse. But it is so darn handy that I had to include a link to it and a plug for it.

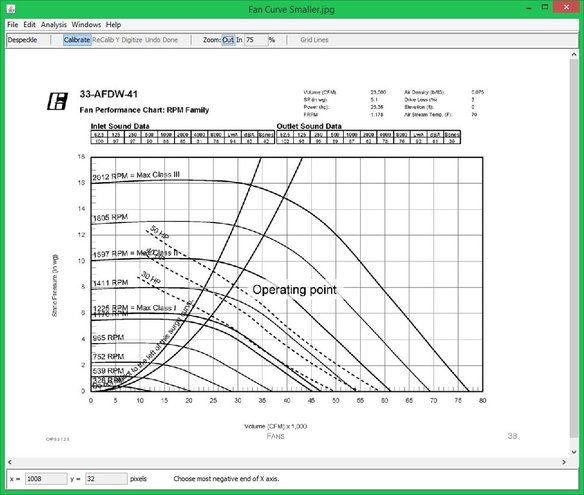
Plot Digitizer is a share-ware Java application that allows you to load an image into its working window (upper image) and digitize it by first clicking on the end points of the X an Y axis and then clicking on the curve or curves you want to capture.  The result is a little Comma Separated Value (CSV) file that you can then load into Excel to recreate the curve. 
 
That can be very powerful because not only does it allow you to take something and format to your liking for a presentation.  Once it is in Excel, you can do calculations with it.

For instance, starting with a single rpm curve relating flow and static pressure for a specific fan speed, you can calculate all of the other rpm curves and plot them by using the affinity laws. You can do a similar thing for the brake horse power line or for different impeller sizes if you are working with a pump curve instead of a fan curve.
 
Then, you can take things a step further by adding the system curve or curves for the system you are analyzing.  Or, you can extrapolate additional information from your data using Excel's trend line feature.
Picture
Picture
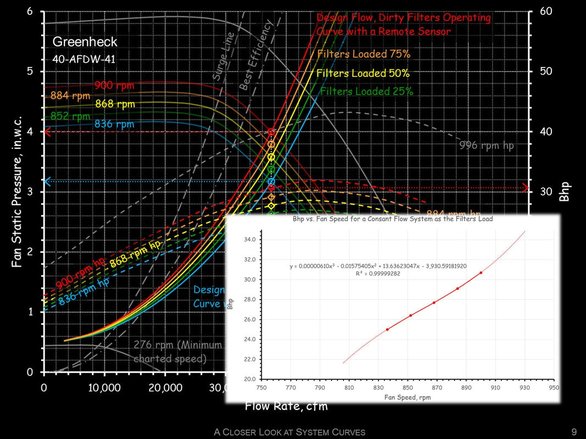
 For example, I created the chart in the lower image by having our Office Admin use Plot Digitizer to capture a speed and brake horsepower line from the Greenheck curve in the upper image and load the raw data into Excel.  Once Dawn had done that, she sent the file to me and I:
  • Added the formatting I wanted
  • Developed system curves for a number of operating conditions created by the filters loading in the constant volume system served by the fan
  • Used the affinity laws to project the fan speeds and brake horse powers required to hold the flow steady as the filters loaded
  • Used a curve fit from those data points to develop a mathematical relationship between fan speed and brake horsepower
  • Programmed that relationship into the control system where we knew the fan speed via an input and wanted to estimate the power being consumed in real time.
Pretty powerful and a lot faster than hand reading the points off of a chart or graph to get them into Excel.  And its free!  For an example of a pump curve that was developed using Plot Digitizer that can also be use as a template for your own pump or fan curve, take a look at the sample and instructions I provided on the Plot Digitizer Pump Curve Example page.

Home

Blog

Resources

Contact

Picture
A Field Perspective on Engineering - © 2017 Facility Dynamics Engineering, All Rights Reserved
(Contact Me to Check on Lefts or Any Other Questions You May Have about Permissions)