Logic Diagram Tool
|
Logic diagrams are a very useful way to convey a control sequence in a generic format. Symbols, by there nature, have very precise definitions. As a result, when you develop logic using symbols, it tends to eliminate any vagaries of the English (or other) language.
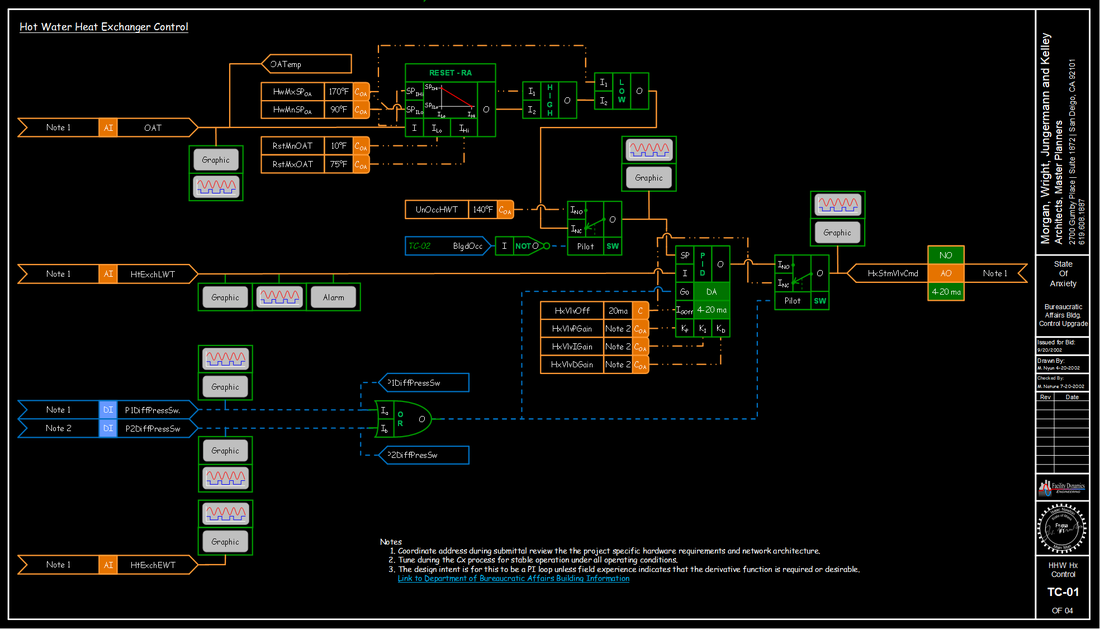
In many ways, logic diagrams are very similar to the flow charts many of us were taught to use when we learned computer programming. As a result, by developing a logic diagram to convey your intended control sequence, you are creating a flow chart for your desired sequence. As long as you supplement it with the definition of your symbols, the logic diagram can be used to convey your intent to any control system technician for implementation in the proprietary programming language of their particular system. The image at the top of the page is an example of a logic diagram. Specifically, it is the logic for controlling the steam heat exchanger in the hot water system illustrated below and to the right of it. The logic diagram was created in a spreadsheet tool we have developed that lets you paste symbols from a symbol set onto a grid created by the row height and column width settings in Excel. |
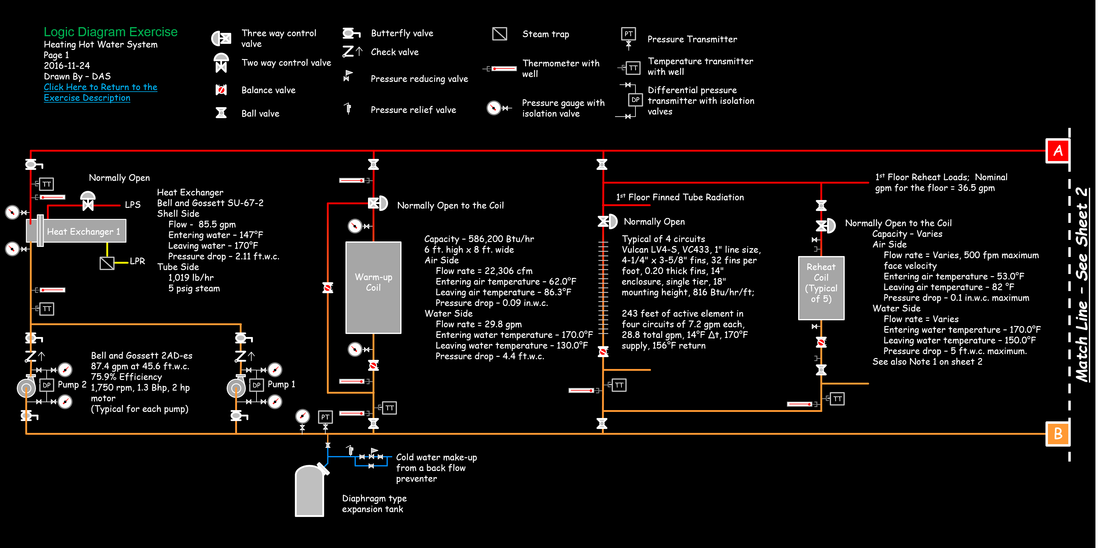
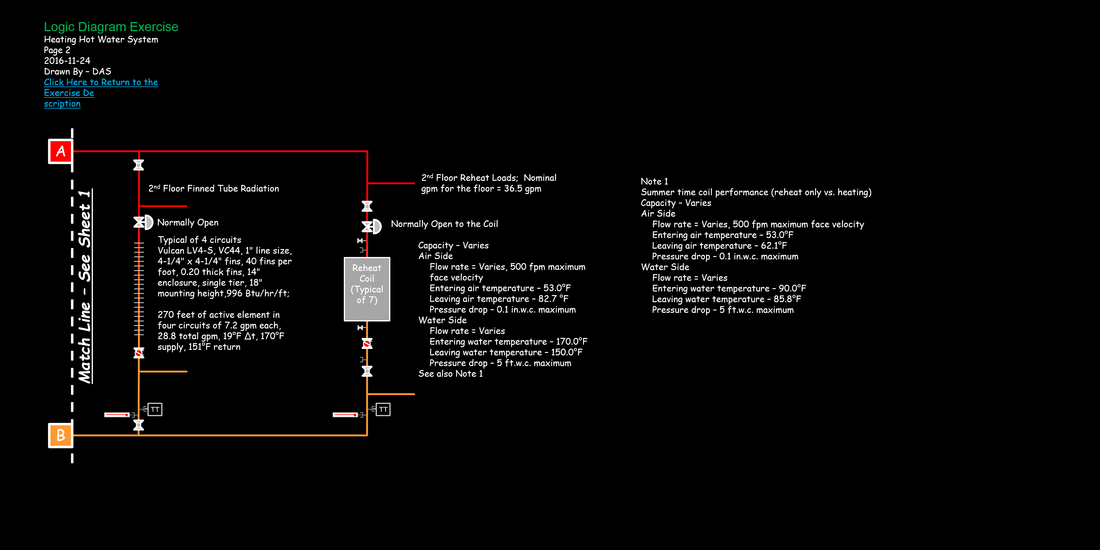
The system diagram for a simple hot water system serving the imaginary Department of Bureaucratic Affairs building model I use in some of my training classes.
|
Turning on the "snap to grid" feature in Excel helps you keep everything orderly. The Logic Diagram Tool, is actually just a "poor man's" version of some of the other programming tools that are out there that you can obtain for free, like Eikon for Educators and WindLGC. Prior to developing the Logic Diagram Tool, I used both of those packages to develop and teach logic. But the challenge was that there is a learning curve associated with using either one and in a class room setting, I found that I was spending a lot of my time teaching the tool rather than teaching the use of the tool. The Logic Diagram tool tries to leverage the familiarity many people have with Excel and Microsoft Office drawing objects. And it is not vendor specific where as the other products are associated with specific vendors; Automated Logic Controls for Eikon and IDEC for WindLGC.
Having said that, even though there are probably more people familiar with drawing with Microsoft drawing objects, there still may be some who are not up to speed on that. The techniques are fairly easy to pick up and a there are a lot of tutorials out there on the web that will help you understand them. Here are a few that we think will give you the basics you need to get up and running using the logic diagram tool (they also are included in the instruction tab of the tool).
Note that while the tutorials are specific to a particular MS Office product (Word, Excel, PowerPoint, etc.) the techniques you use with the shapes generally apply across all of the product lines.
You may also find a couple of the GoToMeeting sessions I recorded with students to help them develop their system diagrams to be useful because in them we are working with MS Office drawing objects similar to the ones used in the logic diagram tool. All of the students offered to share the meetings in case the information would be helpful to others, so hats off to them for their willingness to do that.
The downside of the Logic Diagram tool relative to the vendor tools is that both of the vendor tools allow you to run your logic in a simulation mode once you have created it. That is a really useful feature in terms of making sure the your logic is truly going to do what you intended before you send it out into the field. And, since both of those tools are vendor tools, you can actually take the logic you created and load it directly into the product it is associated with if that happens to be the product in use on your project. If you want to know a little bit more about either tool, we have a webpage that includes a bit more information along with some example programs that you can download and play with.
The files below will provide you with the current version of the spreadsheet tool along with a PowerPoint file that contains the symbol set and an explanation of how to use the symbols in case you want to try your hand at it. If you put the two files in the same folder, then you should be able to click on the links next to the symbols on the symbol list tabs in the Excel Spreadsheet and open up the relevant PowerPoint slide associated with the symbol, which includes an explanation of how it is to be used and what the various connections on the logic block are for.
Having said that, even though there are probably more people familiar with drawing with Microsoft drawing objects, there still may be some who are not up to speed on that. The techniques are fairly easy to pick up and a there are a lot of tutorials out there on the web that will help you understand them. Here are a few that we think will give you the basics you need to get up and running using the logic diagram tool (they also are included in the instruction tab of the tool).
- How to Add Shapes in Microsoft Word 2016
- How to Draw Shapes in Microsoft Word 2016 Drawing Tools Tutorial
- How to Add Connectors to PowerPoint Shapes
- Excel Shortcut - Snap to Grid - Podcast 2140
- Excel 2016 Training Part 6: How to Customize the Quick Access Toolbar With Excel 2016
Note that while the tutorials are specific to a particular MS Office product (Word, Excel, PowerPoint, etc.) the techniques you use with the shapes generally apply across all of the product lines.
You may also find a couple of the GoToMeeting sessions I recorded with students to help them develop their system diagrams to be useful because in them we are working with MS Office drawing objects similar to the ones used in the logic diagram tool. All of the students offered to share the meetings in case the information would be helpful to others, so hats off to them for their willingness to do that.
The downside of the Logic Diagram tool relative to the vendor tools is that both of the vendor tools allow you to run your logic in a simulation mode once you have created it. That is a really useful feature in terms of making sure the your logic is truly going to do what you intended before you send it out into the field. And, since both of those tools are vendor tools, you can actually take the logic you created and load it directly into the product it is associated with if that happens to be the product in use on your project. If you want to know a little bit more about either tool, we have a webpage that includes a bit more information along with some example programs that you can download and play with.
The files below will provide you with the current version of the spreadsheet tool along with a PowerPoint file that contains the symbol set and an explanation of how to use the symbols in case you want to try your hand at it. If you put the two files in the same folder, then you should be able to click on the links next to the symbols on the symbol list tabs in the Excel Spreadsheet and open up the relevant PowerPoint slide associated with the symbol, which includes an explanation of how it is to be used and what the various connections on the logic block are for.
|
| ||||
| Custom Theme Color Pallets (theme_color_palletes.zip) |
The first tab of the spreadsheet contains some instructions to help get you started.
As a "Heads Up", The tool has a couple of macros that let you turn the grid on and off and change the background color from black to white. So, you will need to save the tool as a macro enabled file and enable the macros for those features to work.
The background color change hinges on two custom color pallets I have created; FDE Primary.xml and FDE Primary White.xml, which are referenced by the macros. As far as I know, those pallets will come in with the spreadsheet when you save it.
But, if the colors see odd when you run the macro's, then an issue with the color pallets is the most likely problem (other than my being an engineer and perhaps having no sense of color). So just in case, I have also included copies of the .xml files associated with the color pallets (they are themes) so you can access them and install them on your machine if you need to.
On my machine, the files are in this location:
C:\Users\dsellers\AppData\Roaming\Microsoft\Templates\Document Themes\Theme Colors
So, you will need to put them in a similar location on your machine. Note that the AppData folder is a hidden folder by default, so to see it you need to use this procedure.
Finally, you will find a number of articles that Jay Santos wrote and a few that I wrote about control system design and logic diagram development on our Magazine Articles page.
As with the other resources on the web site, we are happy to share them with you, but we are sharing them "as is" and you are using them at your own risk. We consider them to be intellectual property and copyrighted, so please visit our copyright and permissions page before using them so you understand our conditions for sharing them with you.
Logic Diagram Examples
The links below will take you to pages with logic diagram examples. Some of them are examples developed using the logic diagram tool and in those cases, a copy of the tool with the logic in it is provided. Others are sanitized examples from different projects which are generally in the form of .pdf files.
Note that I will be adding more diagrams over time. Right now I have a backlog of examples, meaning I hope to add those as quickly as I can. Once I have worked through the backlog, I will keep adding diagrams when I come across something that is not already illustrated. So, check back occasionally and you will likely find more examples.
Note that I will be adding more diagrams over time. Right now I have a backlog of examples, meaning I hope to add those as quickly as I can. Once I have worked through the backlog, I will keep adding diagrams when I come across something that is not already illustrated. So, check back occasionally and you will likely find more examples.